
SaaS productDeveloper tools
Datadog
Monitoring and observability platform for infrastructure, application performance, logs and errors, with 1,000+ integrations and a free tier for up to five hosts.
16 years active (founded 2010)

Essential details
- Pricing
- Freemium · Free plan · Free trialFree tier up to 5 hosts; products billed per host or by volume, annually or on demand; 14-day trial
- Platforms
- Web, Linux, Windows, macOS, iOS, Android, API
- Service region
- Worldwide
- Website
- www.datadoghq.com
Details last checked 10 October 2026
Photos
Datadog's stand at the AWS Summit in Toronto in 2018, with a host map dashboard on the display. Datadog co-founders Olivier Pomel (left) and Alexis Lê-Quôc, from the company's 2025 press kit.
About Datadog
Datadog is a monitoring and observability platform delivered as software as a service. It brings metrics from servers and containers, traces from applications and logs from every service into one place, so a team can move from an alert to the slow request or failing host behind it without switching tools. The company was founded in New York in 2010 by Olivier Pomel and Alexis Lê-Quôc and is listed on Nasdaq.
Data reaches Datadog through the Datadog Agent, which runs on Linux, Windows and macOS hosts and inside Docker and Kubernetes, and through more than 1,000 integrations covering cloud providers, databases, web servers, CI tools and chat and paging services. Accounts are created on one of several regional sites in the US, the EU, the UK, Japan and Australia; each site is independent and data is not shared between them.
Key features
- Infrastructure Monitoring. Host and container metrics, dashboards, host maps and alerting, with 15-month metric retention on paid plans.
- APM. Distributed tracing that follows a request across services, with per-host pricing.
- Log Management. Ingest, index and archive logs, with separate prices for ingestion, indexed events and long-term Flex storage.
- Error Tracking. Groups application errors into issues and is sold separately by error volume.
- Synthetic and Real User Monitoring. Scripted checks of APIs and pages, and measurement of what real visitors experience.
- Mobile and API access. iOS and Android apps for dashboards and alerts on the go, and an HTTP API for automation.
Who it is for
Datadog suits engineering and operations teams running services on cloud platforms or Kubernetes who want one system for metrics, traces and logs. Small teams can start on the free tier, while larger organisations use it across hundreds of hosts with security and governance features on the Enterprise tiers.
Pricing at a glance
- Infrastructure Free: $0 for up to five hosts, with one-day metric retention.
- Infrastructure Pro: $15 per host per month billed annually, or $18 on demand.
- Infrastructure Enterprise: $23 per host per month billed annually, or $27 on demand; adds machine-learning alerts and Live Processes.
- APM: from $31 per host per month billed annually alongside Infrastructure Monitoring.
- Logs: $0.10 per ingested GB, plus $1.70 per million indexed events for 15-day retention, billed annually.
- Error Tracking: a flat $25 a month billed annually for under 50,000 errors a month.
A 14-day free trial needs no credit card. Prices as checked on 10 October 2026; confirm on the vendor's pricing page.
Things to consider
- Each product is billed separately, so a full setup of infrastructure, APM, logs and errors adds up; model the cost per host and per GB before rolling out widely.
- On-demand prices are noticeably higher than annual commitments.
- Log costs depend on both volume ingested and events indexed; filtering what gets indexed is the main lever.
- Choose the regional site carefully at sign-up, since data cannot be shared across sites.
Getting started
- Start the free trial and pick the regional site closest to your data requirements.
- Install the Agent on a host or in your Kubernetes cluster following the Agent documentation.
- Enable integrations for your cloud provider, databases and web servers.
- Add APM tracing libraries to one service and review its traces.
- Build a dashboard and alerts, then connect Slack or PagerDuty for notifications.
Capabilities
- Error monitoring
- Performance monitoring
Pricing, platforms and fit
- Pricing
- FreemiumFree plan · Free trialFree tier up to 5 hosts; products billed per host or by volume, annually or on demand; 14-day trial
- Integrations
- Amazon Web ServicesGoogle CloudMicrosoft AzureKubernetesDockerPostgreSQLMySQLRedisNGINXSlackPagerDutyGitHubJiraTerraform
- Service region
- Worldwide
Reviews
No reviews yet
Ratings appear once our moderators have approved the first review. Nothing is published automatically.
Be the first to reviewWrite a review
Related developer tools
Other published listings in the same category.

Developer toolsDeveloper tool
GitHub
Git-based platform for hosting code, reviewing pull requests, tracking issues and running CI/CD workflows, with free and per-user paid plans.
Freemium · free plan
View detailsContact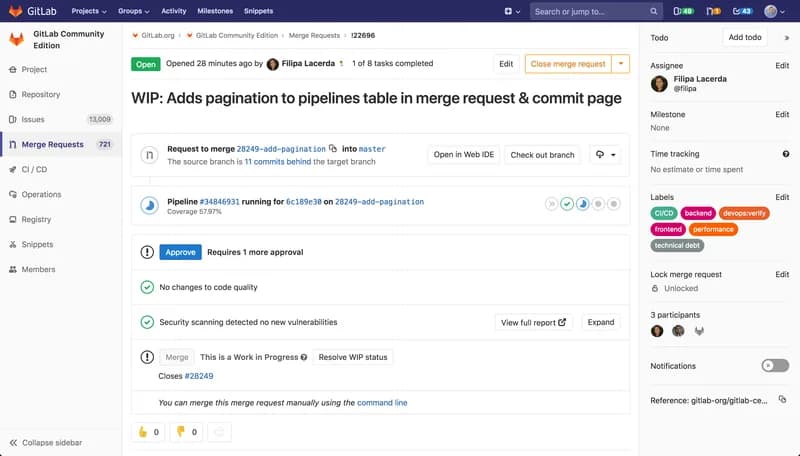

Developer toolsDeveloper tool
GitLab
DevSecOps platform combining Git repositories, merge request reviews, CI/CD pipelines and issue tracking, offered as SaaS, dedicated or self-managed.
Freemium · free plan
View detailsContact

Developer toolsDeveloper tool
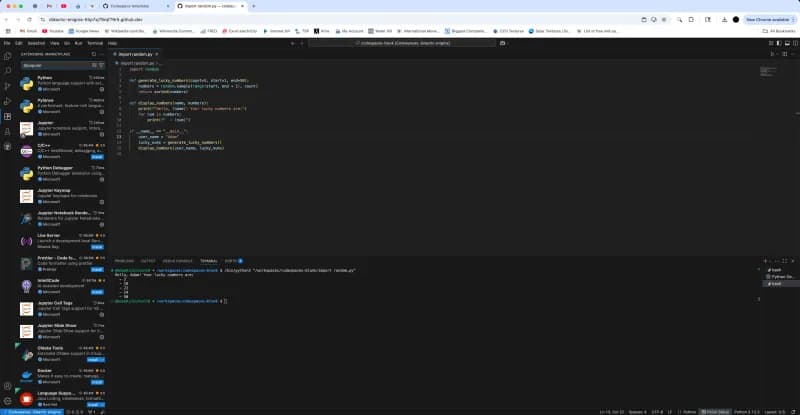
Visual Studio Code
Free source-code editor from Microsoft for Windows, macOS, Linux and the browser, with built-in Git, debugging, a terminal and an extensions marketplace.
Free
View detailsContact

Developer toolsDeveloper tool
Docker
Container platform for building, sharing and running applications, including Docker Desktop, Docker Engine, Docker Hub and Docker Scout.
Freemium · free plan
View detailsContact