
AI agent observability: logging, tracing, costs and failure alerts
Trace every agent run, model call and tool call with OpenTelemetry GenAI conventions, record tokens and cost as metrics, redact prompts, and alert on the failures that matter.
Updated 15 min read
In this article
When an AI agent misbehaves in production, the questions are always the same: which run was it, what did the model see, which tool failed, how many tokens did it burn and what did that cost? Plain application logs rarely answer them, because one user request becomes a dozen model calls and tool calls spread over several seconds. This tutorial instruments a TypeScript agent with OpenTelemetry so that every run is one trace, every model call and tool call is a span with tokens and cost attached, prompts are redacted before they leave the process, and the numbers feed metrics you can alert on.
Tested with: Node.js 24.19.0, TypeScript 7.0.2, @opentelemetry/api 1.9.1, @opentelemetry/sdk-trace-node, sdk-trace-base, sdk-metrics and resources 2.10.0, and @opentelemetry/semantic-conventions 1.43.0. The agent's model calls are scripted so the demo runs without API keys; the instrumentation is the same with a real SDK.
Why use the OpenTelemetry GenAI conventions
You could invent your own field names, but then every dashboard, query and vendor integration is custom. OpenTelemetry publishes semantic conventions for generative AI: standard span names, attributes and metrics for model calls, agents and tools. Two facts matter before you adopt them:
- They have moved. In semantic conventions v1.42.0 (June 2026) the GenAI conventions were moved to a dedicated repository, and the
gen_ai.*definitions in the main repository were deprecated. The npm constants you may find for them are therefore not the place to look; this tutorial uses the attribute names as plain strings from the new repository's documents. - They are not stable. The documents are marked Development. Names have changed before (for example
gen_ai.systembecamegen_ai.provider.name), so keep the names in one module, as the code below does, and check the changelog when you upgrade instrumentation.
The parts this article uses:
| Item | Convention |
|---|---|
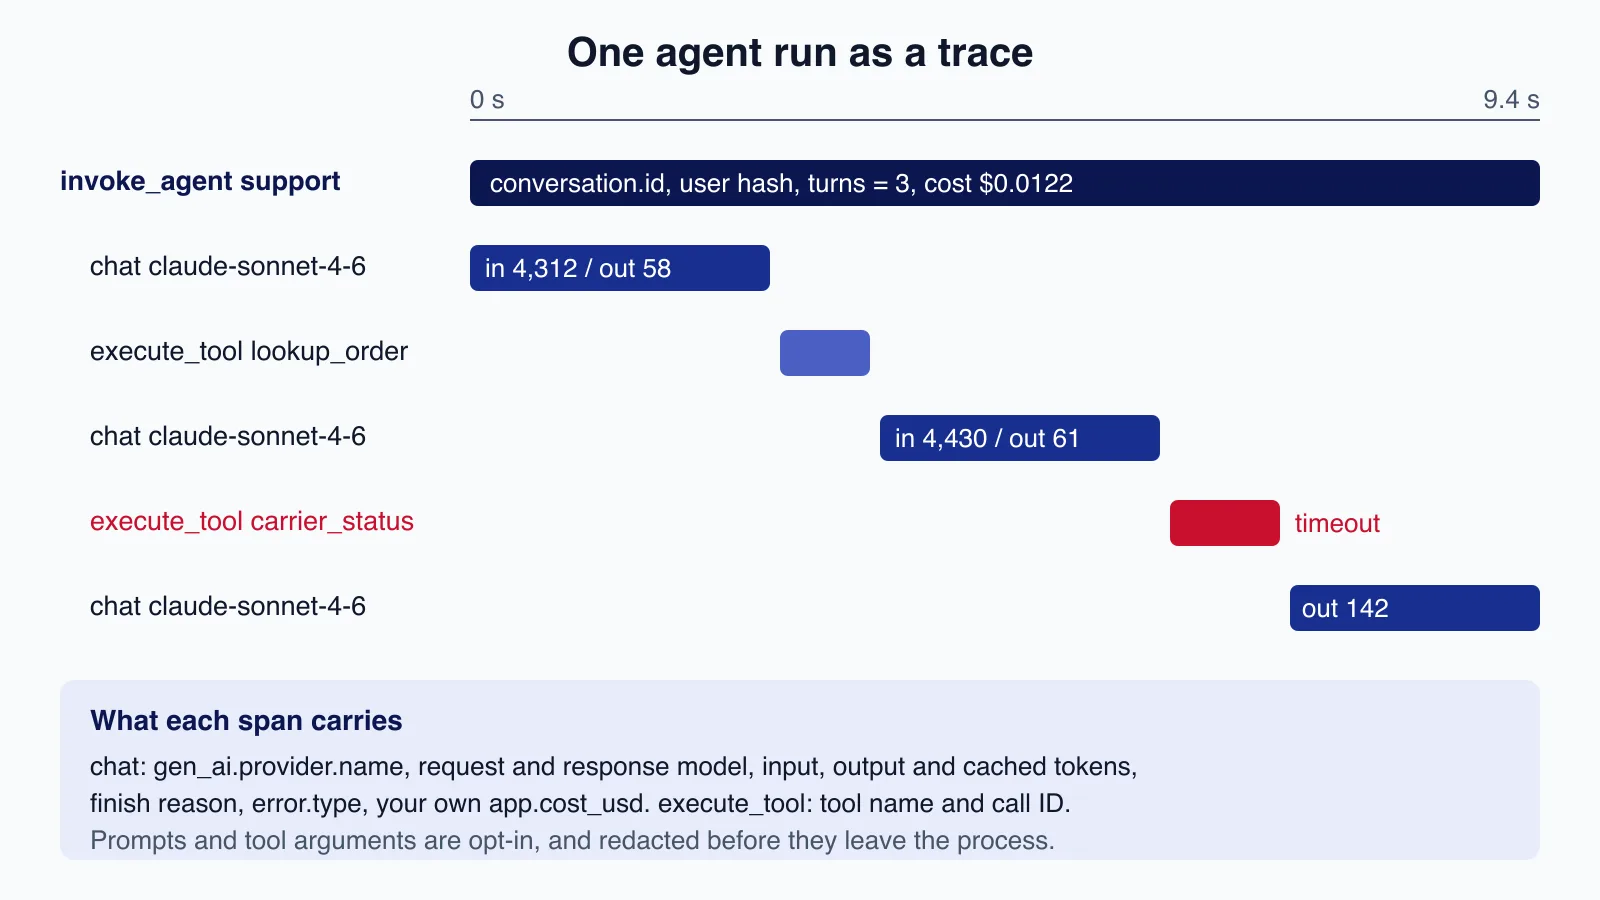
| Agent run span | invoke_agent {gen_ai.agent.name}, with gen_ai.agent.name and gen_ai.conversation.id |
| Model call span | {gen_ai.operation.name} {gen_ai.request.model}, for example chat claude-sonnet-4-6, kind CLIENT |
| Tool span | execute_tool {gen_ai.tool.name}, with gen_ai.tool.call.id |
| Required on model calls | gen_ai.operation.name, gen_ai.provider.name (anthropic, openai, gcp.gemini ...) |
| Usage | gen_ai.usage.input_tokens, output_tokens, cache_read.input_tokens, cache_creation.input_tokens, reasoning.output_tokens |
| Errors | error.type (stable), span status ERROR |
| Content (opt-in) | gen_ai.input.messages, gen_ai.output.messages, gen_ai.system_instructions, gen_ai.tool.call.arguments |
| Metrics | gen_ai.client.token.usage (histogram, {token}, split by gen_ai.token.type input or output) and gen_ai.client.operation.duration (seconds) |
One detail catches many teams: Anthropic's input_tokens excludes tokens read from or written to the prompt cache. The Anthropic page of the conventions says to report gen_ai.usage.input_tokens = input_tokens + cache_read_input_tokens + cache_creation_input_tokens, with the cached parts also recorded separately. If you skip this, a well-cached agent looks almost free in your dashboards.
Step 1: set up the SDK
For the demo, spans and metrics go to in-memory exporters so the output can be printed. In production you replace them with OTLP exporters and a BatchSpanProcessor; nothing else changes.
import { metrics } from '@opentelemetry/api';
import { NodeTracerProvider } from '@opentelemetry/sdk-trace-node';
import { SimpleSpanProcessor, InMemorySpanExporter } from '@opentelemetry/sdk-trace-base';
import { MeterProvider, InMemoryMetricExporter, PeriodicExportingMetricReader, AggregationTemporality } from '@opentelemetry/sdk-metrics';
import { resourceFromAttributes } from '@opentelemetry/resources';
import { ATTR_SERVICE_NAME } from '@opentelemetry/semantic-conventions';

// In production swap the in-memory exporters for OTLP exporters pointed at your collector or vendor
// (OTEL_EXPORTER_OTLP_ENDPOINT, OTEL_EXPORTER_OTLP_HEADERS) and use a BatchSpanProcessor.
export const spans = new InMemorySpanExporter();
export const metricExporter = new InMemoryMetricExporter(AggregationTemporality.CUMULATIVE);
const resource = resourceFromAttributes({ [ATTR_SERVICE_NAME]: 'support-agent', 'deployment.environment.name': 'demo' });

export const tracerProvider = new NodeTracerProvider({ resource, spanProcessors: [new SimpleSpanProcessor(spans)] });
tracerProvider.register(); // sets the global tracer provider and the async context manager

export const metricReader = new PeriodicExportingMetricReader({ exporter: metricExporter, exportIntervalMillis: 60_000 });
export const meterProvider = new MeterProvider({ resource, readers: [metricReader] });
metrics.setGlobalMeterProvider(meterProvider);
Load this module before anything that creates a meter. Traces are forgiving, because trace.getTracer() returns a proxy that starts working once a provider is registered. Metrics are not: in my test, importing the instrumentation module before telemetry.ts produced a complete trace tree and an empty metrics list, with no error. In Node, the usual fix is to start the SDK from a file loaded with node --import ./telemetry.ts.
Step 2: wrap model calls, tool calls and the run
Three small wrappers do all the work: one span per agent run, one per model call and one per tool call. They also record token and cost metrics, attach errors in a standard way, and only capture prompt text when you switch it on.
import { trace, metrics, SpanKind, SpanStatusCode, type Span } from '@opentelemetry/api';

const tracer = trace.getTracer('support-agent', '1.0.0');
const meter = metrics.getMeter('support-agent', '1.0.0');

// Metric names and attributes from the OpenTelemetry GenAI semantic conventions (status: Development).
const tokenUsage = meter.createHistogram('gen_ai.client.token.usage', { unit: '{token}', description: 'Input and output tokens per call' });
const opDuration = meter.createHistogram('gen_ai.client.operation.duration', { unit: 's', description: 'GenAI operation duration' });
// Cost is not part of the conventions, so it lives in our own namespace.
const costCounter = meter.createCounter('app.llm.cost', { unit: 'USD', description: 'Estimated spend from token usage' });

// USD per million tokens. Keep this in config and update it when providers change prices.
export const PRICES: Record<string, { input: number; output: number; cacheRead: number; cacheWrite: number }> = {
  'claude-sonnet-4-6': { input: 3.0, output: 15.0, cacheRead: 0.3, cacheWrite: 3.75 },
  'gpt-5-mini': { input: 0.25, output: 2.0, cacheRead: 0.025, cacheWrite: 0.25 },
};

export type Usage = { input: number; output: number; cacheRead: number; cacheWrite: number };
export type ChatResult = { text: string; toolCalls: { id: string; name: string; args: unknown }[]; usage: Usage; finishReason: string; responseModel: string };

export function costUsd(model: string, u: Usage): number {
  const p = PRICES[model];
  if (!p) return 0; // unknown model: record tokens, alert on missing price
  return (u.input * p.input + u.output * p.output + u.cacheRead * p.cacheRead + u.cacheWrite * p.cacheWrite) / 1_000_000;
}

const EMAIL = /[\w.+-]+@[\w-]+\.[\w.]+/g;
const CARD = /\b(?:\d[ -]?){13,16}\b/g;
export const redact = (s: string) => s.replace(EMAIL, '[email]').replace(CARD, '[card]');
const captureContent = process.env.GENAI_CAPTURE_CONTENT === 'true'; // off by default

// One CLIENT span per model call: "chat {model}".
export async function tracedChat(provider: string, model: string, input: string, call: () => Promise<ChatResult>): Promise<ChatResult> {
  return tracer.startActiveSpan(`chat ${model}`, { kind: SpanKind.CLIENT, attributes: {
    'gen_ai.operation.name': 'chat', 'gen_ai.provider.name': provider, 'gen_ai.request.model': model,
  } }, async (span) => {
    const started = performance.now();
    const base = { 'gen_ai.operation.name': 'chat', 'gen_ai.provider.name': provider, 'gen_ai.request.model': model };
    if (captureContent) span.setAttribute('gen_ai.input.messages', JSON.stringify([{ role: 'user', parts: [{ type: 'text', content: redact(input) }] }]));
    try {
      const r = await call();
      const u = r.usage;
      const cost = costUsd(model, u);
      span.setAttributes({
        'gen_ai.response.model': r.responseModel,
        'gen_ai.response.finish_reasons': [r.finishReason],
        // Normalised total input, including cached tokens, as the conventions require for Anthropic.
        'gen_ai.usage.input_tokens': u.input + u.cacheRead + u.cacheWrite,
        'gen_ai.usage.output_tokens': u.output,
        'gen_ai.usage.cache_read.input_tokens': u.cacheRead,
        'gen_ai.usage.cache_creation.input_tokens': u.cacheWrite,
        'app.cost_usd': Number(cost.toFixed(6)),
      });
      tokenUsage.record(u.input + u.cacheRead + u.cacheWrite, { ...base, 'gen_ai.token.type': 'input' });
      tokenUsage.record(u.output, { ...base, 'gen_ai.token.type': 'output' });
      costCounter.add(cost, base);
      return r;
    } catch (e) {
      fail(span, e);
      throw e;
    } finally {
      opDuration.record((performance.now() - started) / 1000, base);
      span.end();
    }
  });
}

// One INTERNAL span per tool execution: "execute_tool {name}".
export async function tracedTool<T>(name: string, callId: string, args: unknown, run: () => Promise<T>): Promise<T> {
  return tracer.startActiveSpan(`execute_tool ${name}`, { kind: SpanKind.INTERNAL, attributes: {
    'gen_ai.operation.name': 'execute_tool', 'gen_ai.tool.name': name, 'gen_ai.tool.call.id': callId, 'gen_ai.tool.type': 'function',
  } }, async (span) => {
    if (captureContent) span.setAttribute('gen_ai.tool.call.arguments', redact(JSON.stringify(args)));
    try { return await run(); }
    catch (e) { fail(span, e); throw e; }
    finally { span.end(); }
  });
}

// The root span for one agent run: "invoke_agent {name}".
export async function tracedAgentRun<T>(agent: string, conversationId: string, userId: string, run: (span: Span) => Promise<T>): Promise<T> {
  return tracer.startActiveSpan(`invoke_agent ${agent}`, { kind: SpanKind.INTERNAL, attributes: {
    'gen_ai.operation.name': 'invoke_agent', 'gen_ai.agent.name': agent, 'gen_ai.conversation.id': conversationId,
    'app.user.hash': userId, // a pseudonymous ID, never an email address
  } }, async (span) => {
    try { return await run(span); }
    catch (e) { fail(span, e); throw e; }
    finally { span.end(); }
  });
}

function fail(span: Span, e: unknown) {
  const err = e as Error & { status?: number };
  span.setAttribute('error.type', err.status ? String(err.status) : err.name || 'Error');
  span.recordException(err);
  span.setStatus({ code: SpanStatusCode.ERROR, message: redact(err.message) });
}
Design decisions worth copying:
- Cost is your own attribute. The conventions define tokens, not money, so cost lives under
app.cost_usdandapp.llm.cost. Prices come from a table in configuration; when a model is missing from it, cost is recorded as zero, which you should alert on rather than hide. The example rates are Anthropic's published list prices for Claude Sonnet 4.6 ($3 input, $15 output, $0.30 cache read and $3.75 five-minute cache write per million tokens) and OpenAI's for GPT-5 mini ($0.25 input, $0.025 cached input, $2 output). - Content capture is off by default. The conventions mark message attributes as opt-in and warn that they are likely to contain personal data. When you do enable it for debugging, redact in-process, before export.
- Users are pseudonymous. The run span carries a hashed user ID, enough to find one customer's runs, but not an email address.
- Errors use
error.type. A timeout, a 429 and a validation failure become filterable values instead of free text.
Step 3: run an agent
The demo runs one support conversation: the model asks for an order lookup, then a carrier status call that times out, then answers. Each provider response carries Anthropic-style usage with 3,900 cached tokens.
import { spans, metricReader, metricExporter, tracerProvider } from './telemetry.ts'; // must load before genai.ts
import { tracedAgentRun, tracedChat, tracedTool, type ChatResult } from './genai.ts';

// A scripted stand-in for the provider SDK, so the demo runs without API keys.
// Usage fields follow Anthropic's shape: input_tokens excludes cached tokens.
const script: ChatResult[] = [
  { text: '', toolCalls: [{ id: 'toolu_01', name: 'lookup_order', args: { orderId: 'A101' } }],
    usage: { input: 412, output: 58, cacheRead: 3_900, cacheWrite: 0 }, finishReason: 'tool_use', responseModel: 'claude-sonnet-4-6' },
  { text: '', toolCalls: [{ id: 'toolu_02', name: 'carrier_status', args: { tracking: 'ZX9' } }],
    usage: { input: 530, output: 61, cacheRead: 3_900, cacheWrite: 0 }, finishReason: 'tool_use', responseModel: 'claude-sonnet-4-6' },
  { text: 'Your order shipped on 3 August; the carrier tracker is temporarily unavailable.', toolCalls: [],
    usage: { input: 655, output: 142, cacheRead: 3_900, cacheWrite: 0 }, finishReason: 'end_turn', responseModel: 'claude-sonnet-4-6' },
];
const tools: Record<string, () => Promise<string>> = {
  lookup_order: async () => 'order A101 shipped 2026-08-03, carrier ZX',
  carrier_status: async () => { throw Object.assign(new Error('carrier API timed out after 5000 ms'), { name: 'TimeoutError' }); },
};

await tracedAgentRun('support-agent', 'conv_7f3a', 'u_5d41', async (root) => {
  let turn = 0;
  for (;;) {
    const r = await tracedChat('anthropic', 'claude-sonnet-4-6', 'Where is order A101? Email me at jo@example.com', async () => script[turn++]);
    if (r.toolCalls.length === 0) { root.setAttribute('app.turns', turn); return r.text; }
    for (const c of r.toolCalls) {
      try { await tracedTool(c.name, c.id, c.args, tools[c.name]); }
      catch { /* the error is on the span; the model gets an is_error tool result */ }
    }
  }
});

await tracerProvider.forceFlush();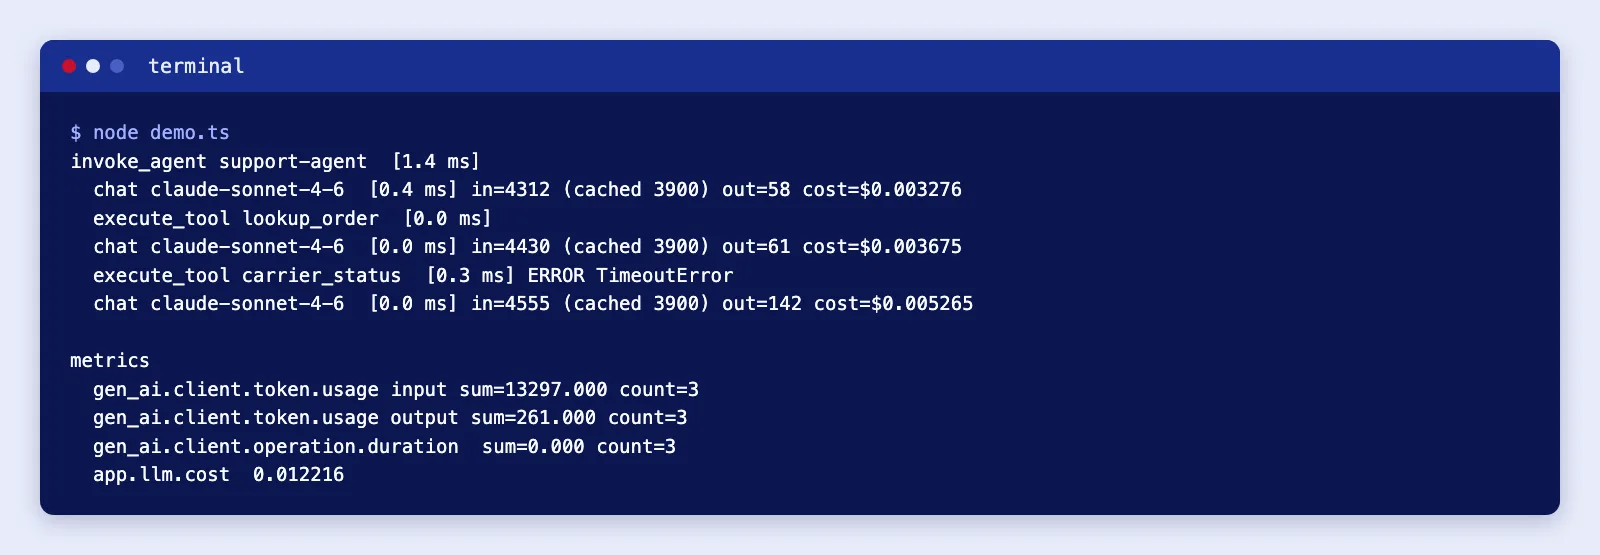
The arithmetic for the first call shows why cache normalisation matters: 412 uncached input tokens at $3, 3,900 cache reads at $0.30 and 58 output tokens at $15 per million come to $0.001236 + $0.00117 + $0.00087 = $0.003276. The span reports 4,312 input tokens, of which 3,900 were cached, and the three calls together cost $0.012216.
Where to send it
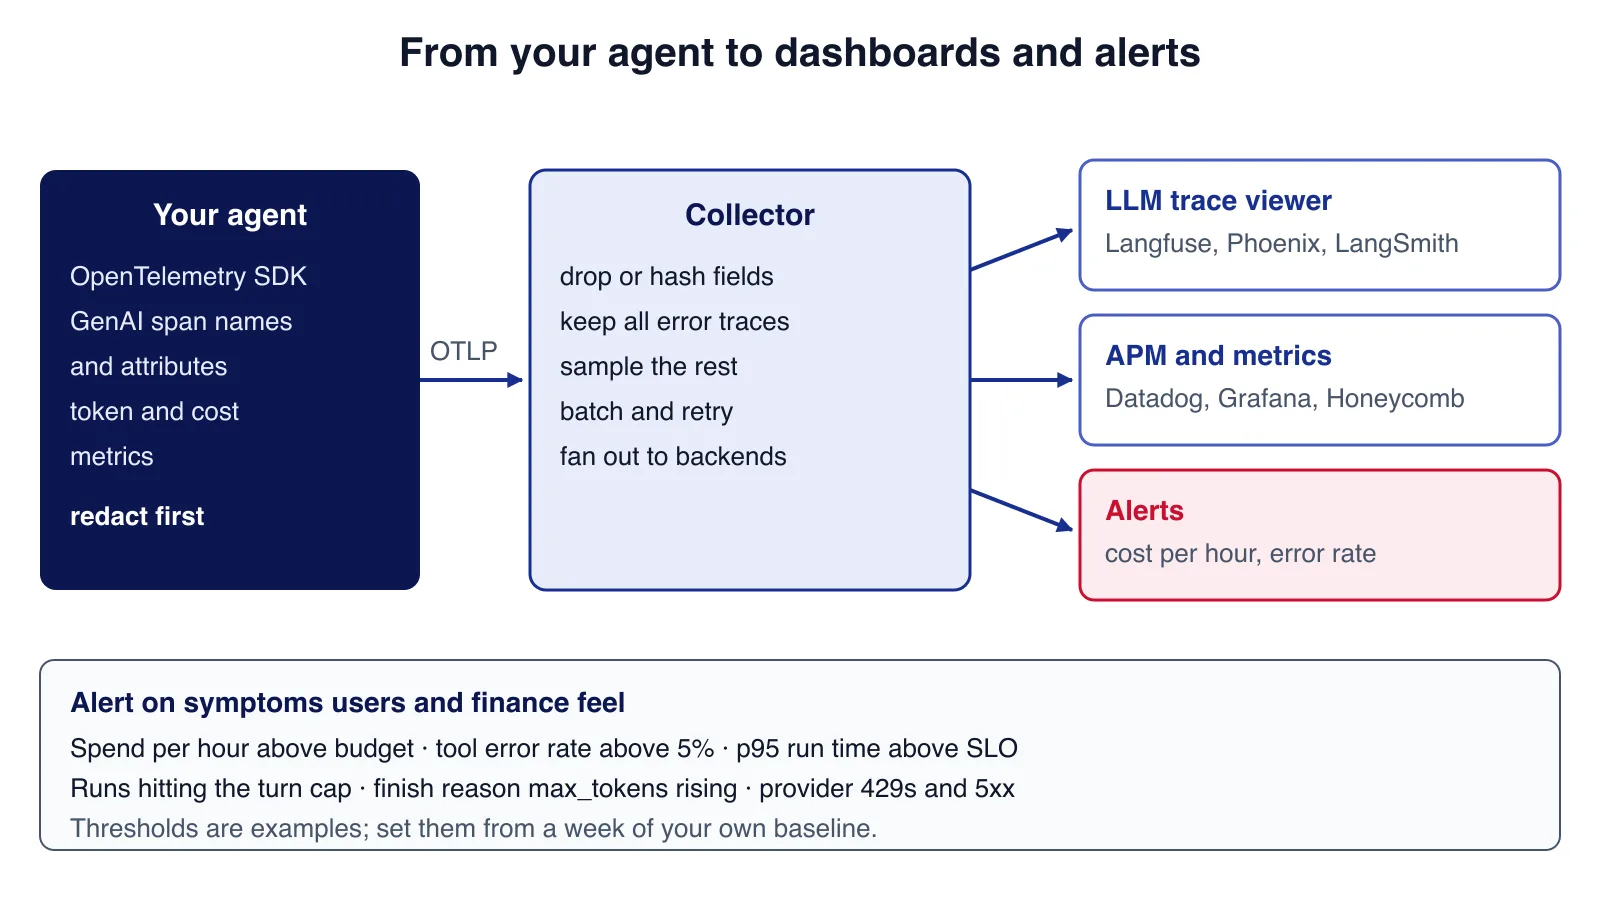
Run an OpenTelemetry Collector between your services and any backend. It lets you delete or hash attributes centrally, keep every trace that contains an error while sampling the rest, and send the same data to two tools while you evaluate them. Options that accept OpenTelemetry data, with prices checked on 10 August 2026:
| Tool | What it is | Cost |
|---|---|---|
| Langfuse | LLM tracing, prompt management and evaluations; OTLP endpoint over HTTP; MIT-licensed core you can self-host | Cloud Hobby free (50k units a month, 30 days of data); Core $29 a month with 100k units then $8 per 100k; Pro $199 a month |
| LangSmith | Tracing and evaluation from the LangChain team, works without LangChain | Developer $0 for one seat and 5k base traces a month; Plus $39 per seat with 10k base traces, then pay as you go; base traces kept 14 days, extended traces 400 days |
| Arize Phoenix | Open-source LLM tracing and evaluation, built on OpenTelemetry | Self-hosted; Elastic License 2.0 |
| Datadog, Grafana, Honeycomb | General observability platforms with OTLP ingestion; Datadog also sells an LLM Observability product | Usage-based; check each vendor's current pricing |
A Langfuse "unit" is any tracing data point (a trace, an observation such as a span, or a score), so one agent run with five spans is about six units. At 2,000 runs a day that is roughly 360,000 units a month, which on Core comes to $29 + 2.6 x $8 = about $50 a month before any sampling.
Sampling without losing the interesting runs
Agent traces are larger than ordinary web traces: a run can hold dozens of spans, and with content capture on, each span can carry kilobytes of text. Keeping everything gets expensive quickly, but random head sampling (deciding at the start of a run) throws away the rare failures you most need. Two practical rules:
- Metrics are never sampled. Token, cost and duration metrics are aggregated in the process, so they stay accurate whatever you do with traces. Budget alerts should read metrics, not traces.
- Sample traces at the end, in the collector. Tail-based sampling waits until a trace is complete, then keeps all traces with an error, all runs above a cost or duration threshold, all runs a user rated badly, and a small share of the rest. The collector's tail sampling processor does this; it needs all spans of a trace to reach the same collector instance, which matters once you run more than one.
Also link traces to the business record. Put your conversation or ticket ID in gen_ai.conversation.id and write the trace ID back onto the ticket, so support staff can jump from a complaint to the exact run.
Alerts that catch real failures
Alert on symptoms that users or the finance team would notice, and derive thresholds from a week of your own data:
- Spend rate. Sum of
app.llm.costper hour above your budget line, and per-tenant spend far above that tenant's normal. - Tool error rate. Share of
execute_toolspans witherror.type, per tool. One broken integration often shows up here before anywhere else. - Run length. p95 duration of
invoke_agentspans, and the number of runs that hit your turn cap; loops are expensive and usually a sign of a confusing tool result. - Truncation. A rising share of
max_tokens(orlength) finish reasons means answers are being cut off. - Provider health. 429 and 5xx rates per provider and model, so you know whether to fail over.
- Missing prices. Any model call where cost is zero but tokens are not.
Approvals that agents request deserve their own panel too; human-in-the-loop AI explains which approval metrics show rubber-stamping or fatigue. For agents that query business data, the audit table described in giving an AI agent safe database access complements traces: traces are sampled and short-lived, the audit log is complete and kept.
If an agent is already live and you cannot answer "what did it cost yesterday and why", Cloudsoft Zone's maintenance and support team can add this instrumentation and the alerts to your existing stack.
Redaction and retention
Prompts and tool results contain whatever users type and whatever your tools return: names, addresses, order details, sometimes card numbers pasted into a chat. Treat telemetry as a copy of production data.
- Leave content capture off in production by default, and enable it per environment or for a sampled share of traffic.
- Redact in the process (as
redact()does) and again in the collector, so one missed path does not leak. - Never put API keys, authorisation headers or raw tool credentials in attributes.
- Set retention deliberately: the LLM tools above keep data for days to years depending on plan. Shorter is easier to defend under GDPR and similar laws.
- Restrict who can read traces with content. Developers debugging latency rarely need to read customer messages.
Common mistakes
- Logging prompts as plain log lines. They end up in a log system with long retention and wide access, without structure.
- One span per request. Without child spans per model and tool call, you cannot see which step was slow or failed.
- Ignoring cached tokens. Under-reporting input on Anthropic, or double-counting it on providers whose input already includes cache hits.
- Hard-coding prices in dashboards. Prices change; keep them in versioned configuration and record the cost at the time of the call.
- Losing the context across async work. Spans started in a queue worker need the trace context passed in the job payload, or the run splits into unrelated traces.
- Trusting experimental names forever. Pin your instrumentation versions and read the GenAI conventions changelog before upgrading.
When not to do all of this
- A single, low-volume model call. If a feature makes one call per user action and nothing else, logging tokens and errors on that request may be enough.
- Prototypes. A hosted tracing tool's SDK is faster to try; move to OpenTelemetry when you need to keep the data or switch vendors.
- Strict data residency with no approved vendor. Self-host the collector and a backend such as Langfuse or Phoenix, or keep content capture off entirely.
Cloudsoft Zone keeps production applications, including AI features, observable and supported: traces, cost dashboards, alerts and on-call fixes. See our application maintenance and support service.
Frequently asked questions
Are the OpenTelemetry GenAI conventions stable?
No. They are marked Development and moved to a dedicated repository in June 2026. They are still the best shared vocabulary; keep attribute names in one module so renames are a small change.
Should I record prompts and responses in traces?
Not by default. The conventions make message content opt-in because it is likely to contain personal data. Enable it per environment or for sampled traffic, and redact before export.
How do I record cost if the conventions have no cost attribute?
Compute it from token usage and a versioned price table, and store it in your own namespace, such as
app.cost_usdon the span and anapp.llm.costcounter.Why are my input token counts so low on Claude?
Anthropic reports cached tokens separately from
input_tokens. Add cache reads and cache writes to get the total input the conventions expect.
Your next customer could start right here.
Introduce your tool, product or business to readers exploring technology.
Explore placements and request a private quote
Sources
- Semantic Conventions v1.42.0 release notes — OpenTelemetry, 2026-06-12
- OpenTelemetry GenAI semantic conventions repository — OpenTelemetry
- Semantic conventions for generative client AI spans — OpenTelemetry
- Semantic conventions for generative AI metrics — OpenTelemetry
- OpenTelemetry JavaScript documentation — OpenTelemetry
- Langfuse pricing — Langfuse
- Langfuse OpenTelemetry integration — Langfuse
- LangSmith pricing — LangChain
- Arize Phoenix — Arize AI
Written with substantial AI assistance. Facts checked against cited sources. Editorial policy.
Comments
No comments yet. Be the first to join the conversation.
Leave a comment
Every comment is read by a moderator before it appears. Your email address is never published; it is used only to contact you about this comment.
More from Cloudsoft Zone

Architecture guideAI and Automation
How to build a safe AI content pipeline with human fact review
An architecture for AI-assisted publishing where people stay responsible: untrusted source snapshots, claim checking with citations, a review queue AI cannot skip, labels and rollback.
By Cloudsoft Zone

TutorialNode.js
How to test a Node.js API with the built-in test runner (node:test)
Write, run, mock and measure coverage for a small Node.js HTTP API using only node:test and node:assert. Covers port-0 servers, fetch(), spies, t.mock.method(), fake dates and coverage thresholds.
By Cloudsoft Zone

TutorialNode.js
Node.js streams in practice: pipeline(), backpressure and async generators
Process files of any size in Node.js with flat memory use. A hands-on guide to stream/promises pipeline(), backpressure, async generator transforms, AbortSignal timeouts and streaming downloads over HTTP.
By Cloudsoft Zone