
Production monitoring for a small SaaS: signals, alerts and recovery evidence you actually need
Build production monitoring around critical user journeys, application errors, queue progress and capacity signals, with actionable alerts and a verified delivery path.
5 min read
In this article
The home page is online, but customers cannot complete an upload and yesterday's invoices remain stuck in a queue. A monitor that checks only whether the domain returns HTTP 200 reports a healthy service.
Production monitoring for a small SaaS should start with the workflows users depend on. This guide defines a small useful signal set, an actionable alert contract and the checks needed to prove the notification path works.
Our NestJS production guide covers the application foundation. Monitoring should extend the existing health, logging and queue owners rather than creating parallel status systems.
Step 1: Identify critical user journeys
Choose a few workflows whose failure has real impact: opening the application, signing in, saving a record, completing an upload or receiving a queued result. Define the intended response and a harmless synthetic way to observe it.
Avoid synthetic payments or customer messages as recurring checks unless the provider and application have an explicitly safe test boundary. Readiness probes should not create unintended business side effects.
| Boundary | Minimal useful observation | Important blind spot |
|---|---|---|
| Public edge | DNS, TLS and a representative route | Private API behavior |
| Application | Error rate and request latency | Background job progress |
| Queue | Oldest relevant job age and completion progress | Browser assets and authentication |
| Database | Required access, latency and capacity | Application-level data validity |
| Host | Memory, disk, inodes and resource pressure | Correct business behavior |
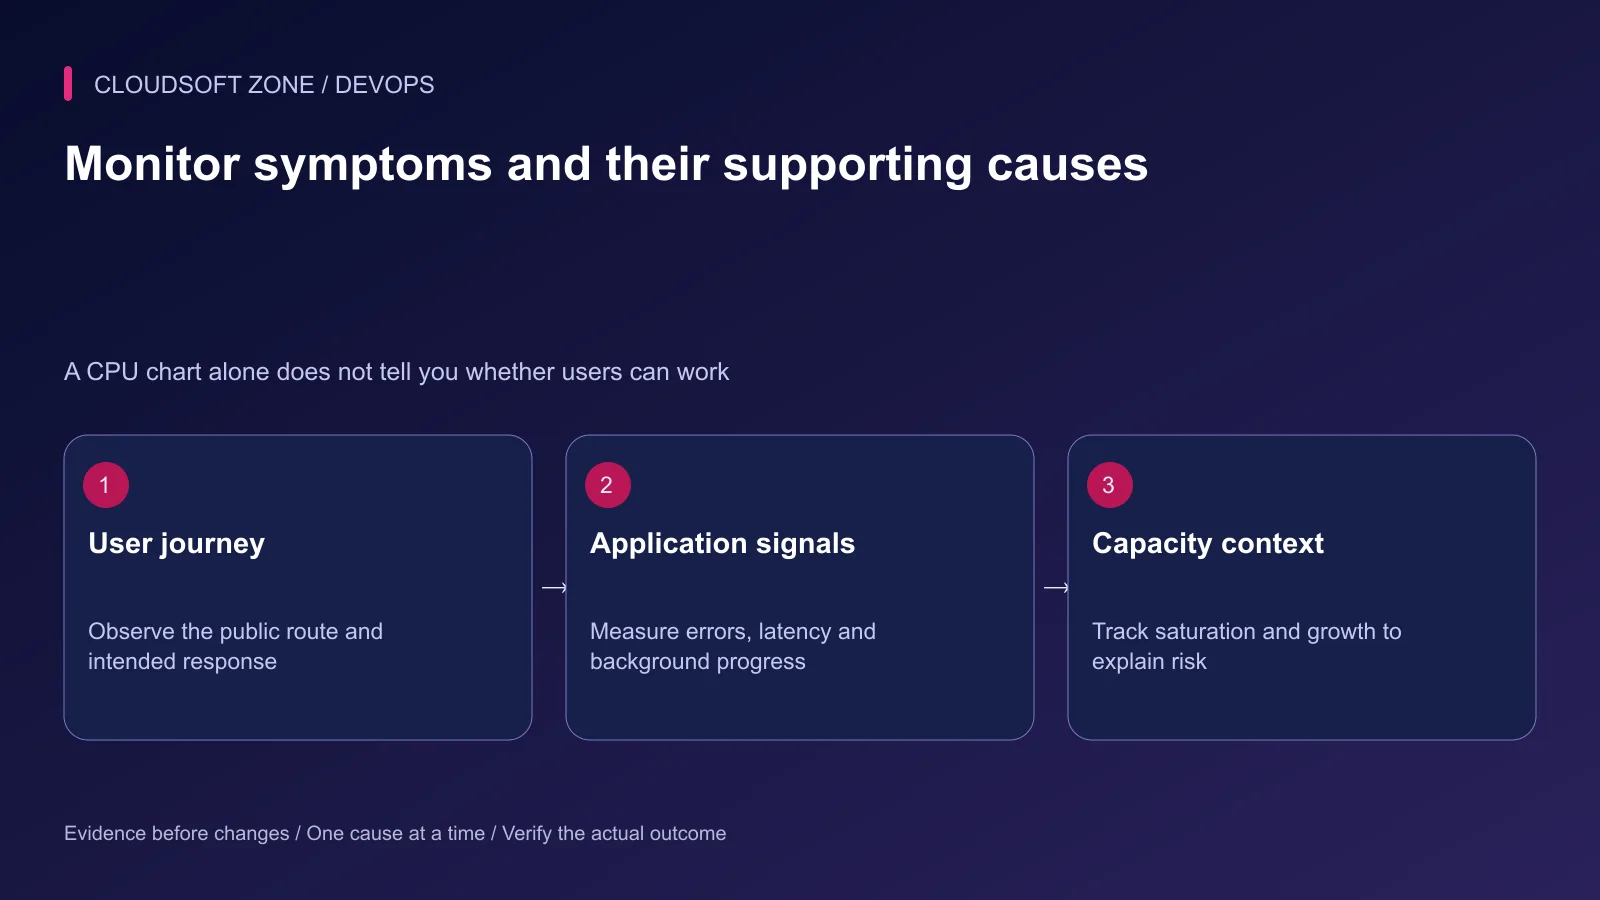
Map each signal to the question it answers. A label called healthy should not combine process liveness with every user outcome.
Step 2: Add a small application signal set for production monitoring
Measure traffic, errors, latency and saturation at the relevant boundary. Separate successful-request latency from fast error responses, and keep route labels bounded using route templates rather than arbitrary URLs.
For a queue-backed workflow, record age and progress as well as count. A queue of ten slow jobs can be more serious than a queue of a thousand jobs completing quickly within the expected budget.
Attach release identifiers and stable request or trace references to useful diagnostics. Do not place user IDs, raw tokens or full request payloads in metric labels.
Step 3: Define what deserves an urgent alert
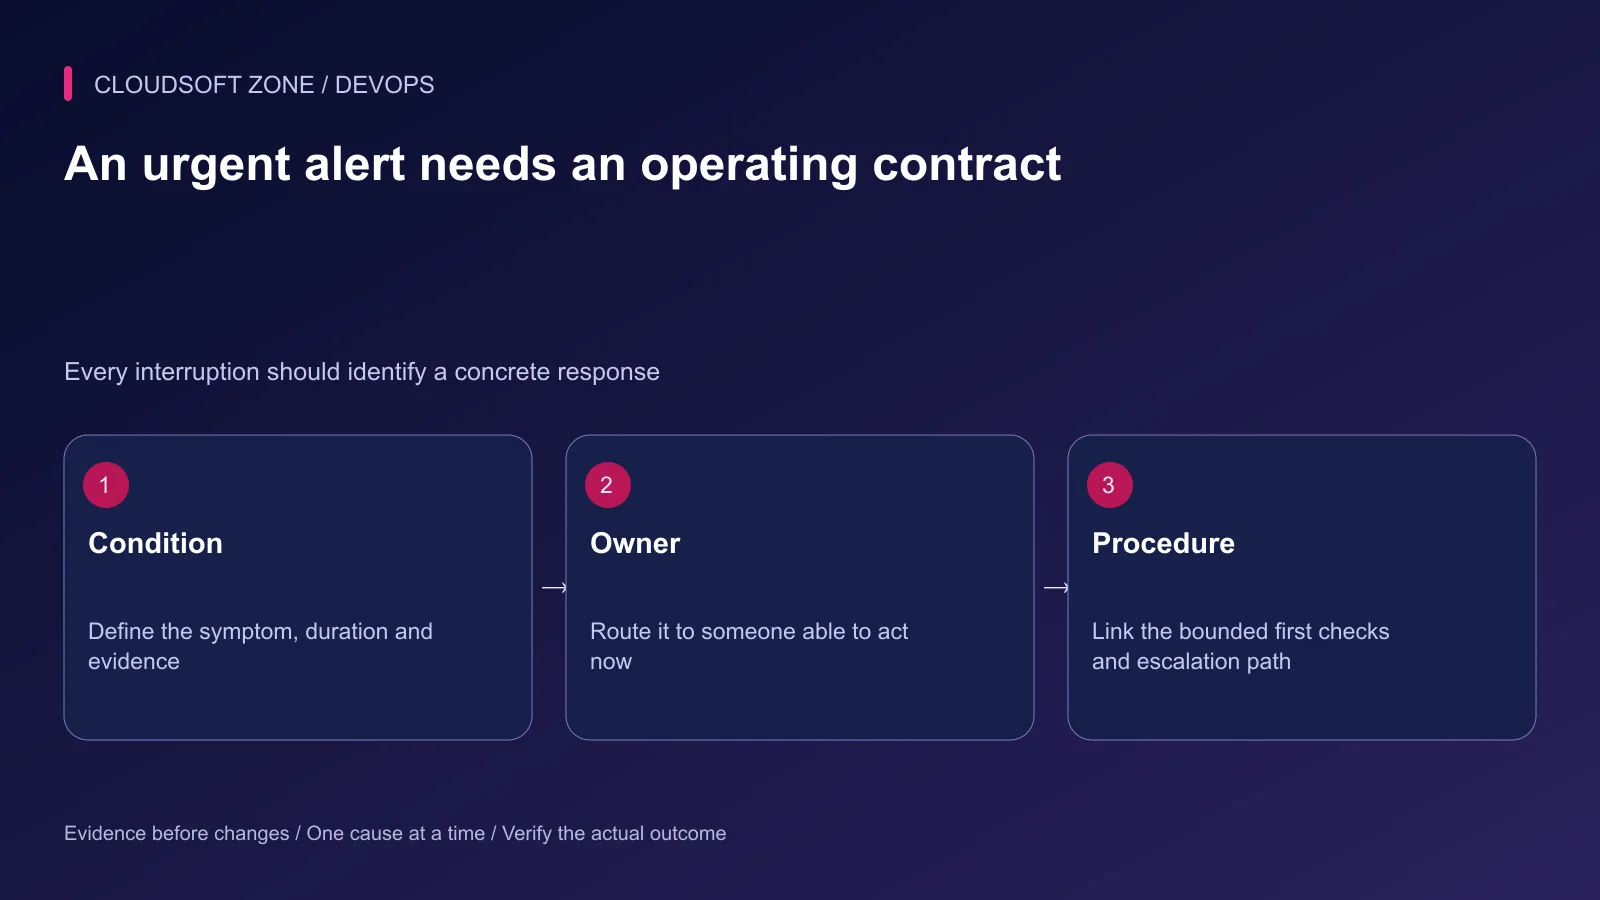
An urgent alert should identify current or imminent service impact and a response that somebody can perform. Trend warnings about storage growth may belong in a planning ticket rather than a midnight page.
Specify duration, thresholds and missing-data behavior. A single failed sample and a sustained inability to serve users are different conditions.
Low traffic requires special care. A percentage error threshold may be noisy with one request or silent when no requests arrive. Combine meaningful windows with independent synthetic checks rather than pretending a high-volume ratio suits every small application.
Step 4: Write one understandable alert contract
For a Prometheus-based stack with an existing blackbox probe job, the following rule illustrates a sustained public probe failure. It assumes the probe target and expected response are already configured correctly.
groups:
  - name: public-availability
    rules:
      - alert: PublicApplicationProbeFailed
        expr: probe_success{job="public-web"} == 0
        for: 2m
        labels:
          severity: page
        annotations:
          summary: "The configured public application probe is failing"
          description: "Inspect DNS, TLS, edge routing and the expected response."
The two-minute duration is a rehearsal example, not a universal service promise. Configure routing and ownership separately. Also alert on missing scrape targets or probe data; this expression does not fire when the series disappears entirely.
A passing probe establishes only its configured request. If it checks a static page, do not label it authenticated-workflow health.
Step 5: Keep one compact operational dashboard
Place public success, application errors, latency and queue age near the top. Show release events and dependency saturation as supporting context. Give each panel a clear unit and time window.
Prefer a small dashboard that answers whether users are affected and where to look next. A wall of unrelated infrastructure charts can hide the first useful observation during an incident.
Keep metric and dashboard endpoints private or authenticated. Health and telemetry output can reveal internal routes, hostnames and workload details even when no password is displayed.
Step 6: Monitor the delivery path
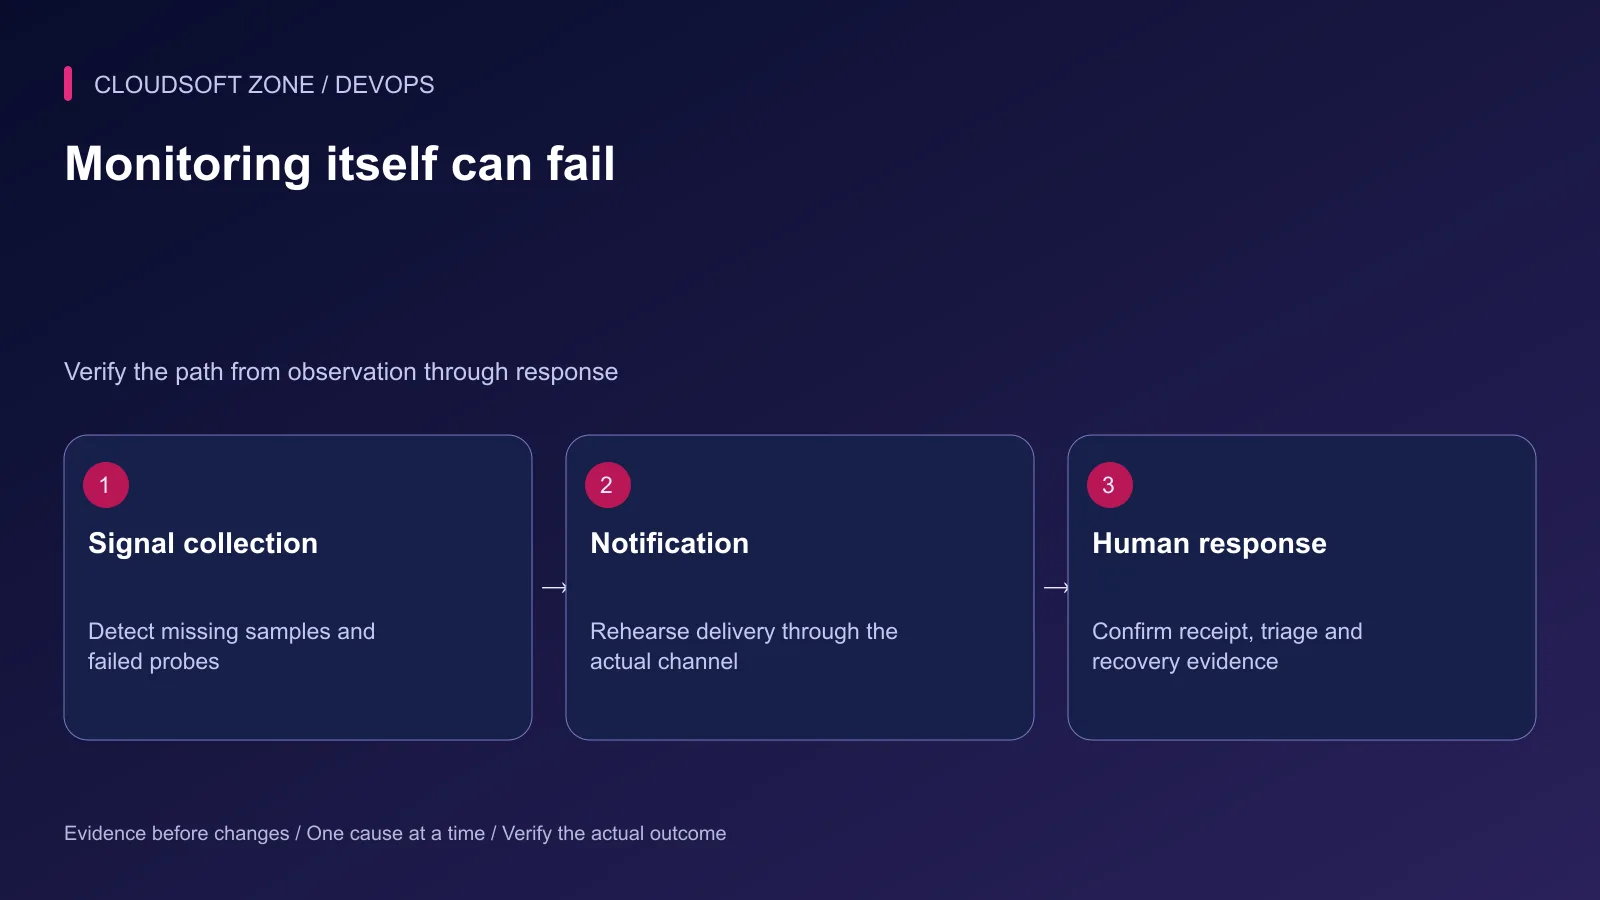
Send a controlled synthetic alert through the actual route and confirm receipt. Check escalation behavior when the primary owner is unavailable. A configuration test that never reaches the recipient is insufficient evidence.
Keep an independent view of complete host failure. If monitoring, mail and the application all depend on the same VPS, that VPS cannot reliably report every condition in which it disappears.
| Rehearsal | Required observation |
|---|---|
| Public probe fails | Owned alert arrives within the intended window |
| Probe data disappears | Separate missing-data signal identifies it |
| Queue stops progressing | Relevant workflow-age alert detects impact |
| Capacity approaches exhaustion | Planning or urgent response matches the risk |
| Notification channel fails | Alternative route or escalation remains usable |
Step 7: Verify recovery and improve the signals
After a mitigation, confirm the original workflow succeeds and observe stability for a defined interval. A restarted process or green scrape target is not sufficient closure evidence.
Review noisy alerts and incidents that monitoring missed. Change the condition or response contract based on evidence rather than disabling the entire route after repeated nuisance messages.
Our Laravel queue guide comparison explains background-processing boundaries. For monitoring fitted to your SaaS and operating team, discuss the project with Cloudsoft Zone.
Featured image: Cloudsoft Zone technical layout with nestjs artwork by NestJS (Public domain). Product mark resized proportionally for identification; no endorsement implied. Layout: CC BY-SA 4.0.
Frequently asked questions
Is uptime monitoring enough for a small SaaS?
No. A public response can succeed while login, queues or data writes fail. Add checks for the critical workflows and supporting application signals.
Should every capacity threshold page the operator immediately?
No. Distinguish urgent user impact from planning trends and diagnostic context, and give every page an actionable response.
How do I know alerts actually reach someone?
Rehearse a controlled synthetic alert through the real delivery route and confirm receipt and response, not just a successful configuration save.
Sources
- User-visible and internal monitoring signals — Google SRE
- Monitoring system design — Google SRE
- Alerting tied to service objectives — Google SRE
- Practical alert rules — Prometheus
Read next
TutorialDevOps5 min read
Automated rollback for VPS deployments: release identity, compatibility and recovery gates
Design automated rollback around an exact previous release, schema compatibility and verified user recovery instead of blindly reverting every failed deployment.
Comments
No comments yet. Be the first to join the conversation.
Leave a comment
Every comment is read by a moderator before it appears. Your email address is never published; it is used only to contact you about this comment.
More from Cloudsoft Zone
ComparisonDevOps5 min read
Blue-green vs rolling vs recreate deployments: choose a strategy your small team can operate
Compare blue-green vs rolling vs recreate deployments through capacity, mixed-version compatibility, worker behavior and realistic recovery requirements for a small team.
By Nilesh Kushvaha
TutorialDevOps5 min read
Stop a failed database migration from turning into a broken production deployment
Contain a failed database migration with explicit release gates, schema postconditions and reviewed recovery instead of switching code or retrying blindly.
By Nilesh Kushvaha
TutorialDevOps5 min read
GitLab CI/CD for Laravel: test, build and deploy a reviewed release to a VPS
Design GitLab CI/CD for Laravel with a reviewed PHP image, disposable MySQL checks, explicit artifacts, protected credentials and serialized VPS deployments.
By Nilesh Kushvaha