
Application health checks: why uptime monitoring misses real failures
Design application health checks that separate liveness, readiness and real user outcomes, without creating restart storms or dangerous synthetic side effects.
5 min read
In this article
The load balancer sees HTTP 200 from a status endpoint, but users cannot sign in because the application cannot access its session store. A green uptime chart is accurate about its request and incomplete about the product.
Application health checks need explicit contracts. Separate process liveness, instance readiness and representative user outcomes, then define the action each failure should trigger. This guide applies to Laravel, NestJS and container-backed services.
Our NestJS production guide covers the application foundation. Extend the existing health owner rather than adding competing routes with conflicting meanings.
Step 1: Define what passing application health checks establish
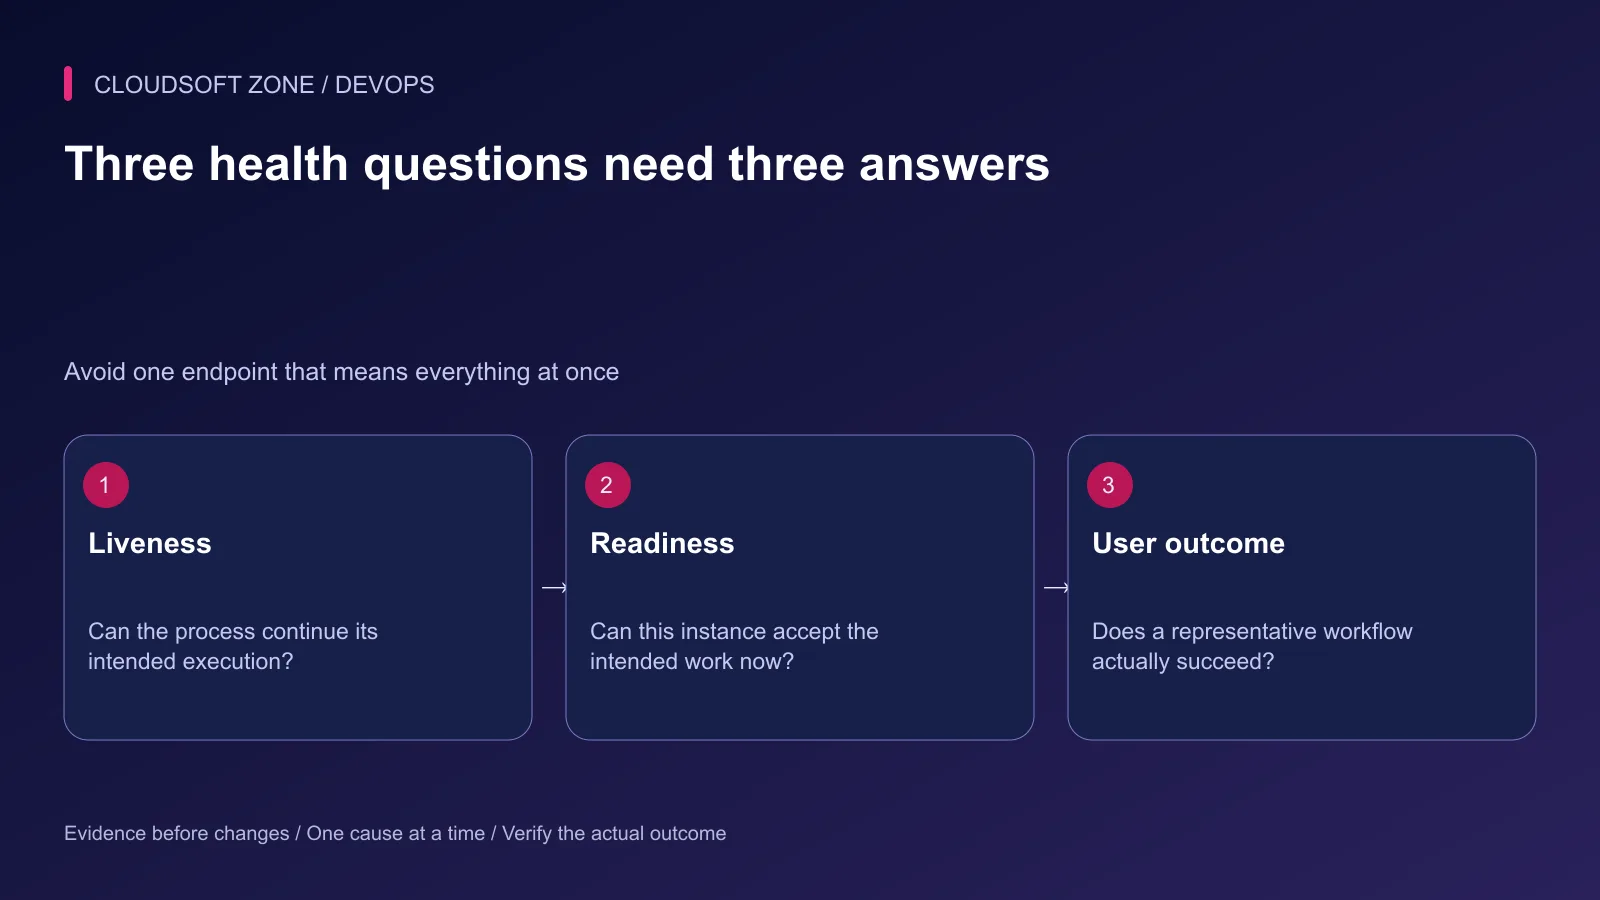
A health response should answer a narrow question. A successful application boot, database ping and completed authenticated workflow are different observations.
| Signal | Establishes | Typical consumer |
|---|---|---|
| Liveness | Process can continue useful execution | Restart controller where appropriate |
| Readiness | Instance can accept its intended workload | Traffic router or deployment gate |
| Dependency check | One required dependency responds as configured | Diagnostics or readiness policy |
| Synthetic journey | One representative user path succeeds | External monitor and incident response |
Document intentional blind spots. A public static page cannot establish private API health. A successful connection does not establish that a required table exists or that background consumers are progressing.
Step 2: Keep liveness independent of avoidable shared failures
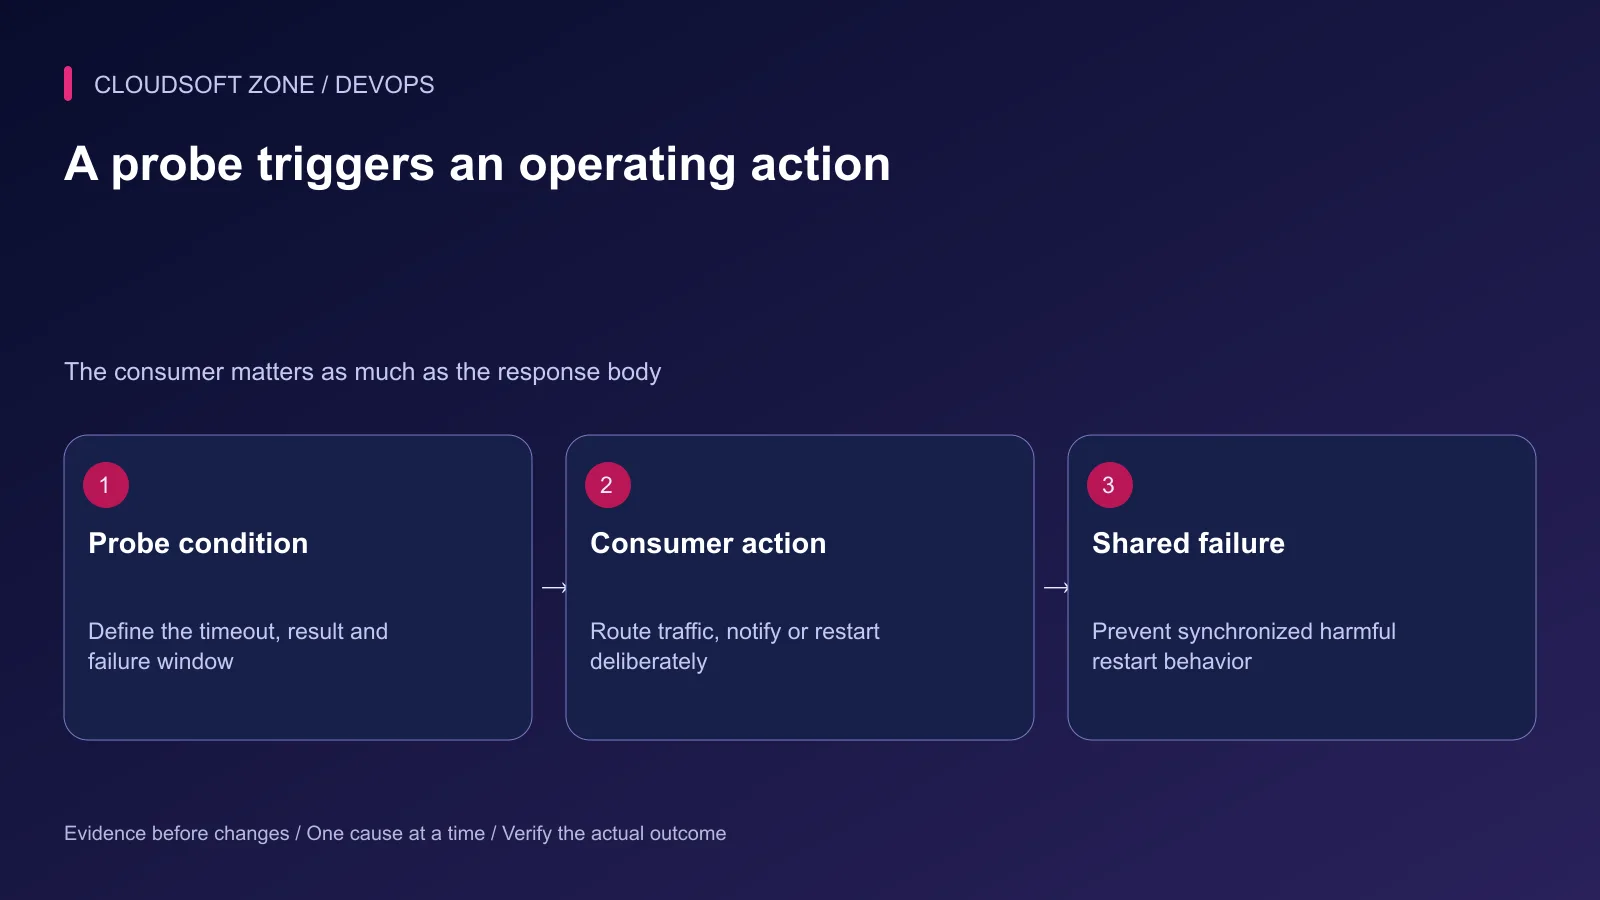
Restarting a deadlocked process can be useful. Restarting every healthy process because their common database is unavailable usually does not repair that database and may add reconnection pressure.
Choose liveness conditions based on failures a restart can plausibly fix. Where a controller is configured, set startup timing and failure windows based on observed application behavior rather than arbitrary aggressive defaults.
A Kubernetes startup probe can prevent premature liveness and readiness probing during initialization. That is different from making a slow-starting service look ready immediately.
Do not copy Kubernetes probe actions into an ordinary Compose deployment. A Docker health check marks a container's status; restart policies ordinarily react to process exit. Identify the actual health-status consumer in your stack.
Step 3: Bound readiness checks
Readiness can include required dependency access, but each check needs a deadline and a controlled cost. A probe that runs a large query every few seconds can compete with real traffic during an outage.
Check the minimal capability needed for the workload. Keep query and connection timeouts shorter than the probe budget, and cap concurrency when probes overlap. Decide whether short-lived cached results are acceptable and state the resulting detection delay.
Laravel's default health route establishes that the application boots without an exception. It does not automatically verify every dependency. NestJS Terminus supports configured indicators; importing the package does not select a truthful application-specific health contract for you.
Step 4: Expose minimal public output
Public probes should not expose connection strings, internal hostnames, exception stacks, file paths or customer data. Keep detailed diagnostics behind the appropriate private network or authenticated operational boundary.
Use a small response contract that distinguishes success and failure without revealing unnecessary implementation details. Preserve the expected HTTP status, content type and cache behavior. Do not let a CDN cache an old successful readiness response indefinitely.
For an already implemented public endpoint, this diagnostic request has a finite network budget:
curl --fail --silent --show-error \
  --connect-timeout 2 \
  --max-time 5 \
  https://app.example.com/health/public
The hostname and path are reader examples. A successful command establishes a non-error HTTP response within the budget, not the response body's business meaning. A monitoring integration must also validate the expected status and allowed response fields. Run credential-bearing checks through protected configuration rather than putting secrets into shell history.
Step 5: Add a safe synthetic journey
Choose a harmless representative operation and an explicitly isolated identity. Define the permissions, frequency, cleanup ownership and expected outcome before automating it.
A read-only synthetic check might verify that an authorized test account can reach a designated test resource. A write workflow requires a dedicated test boundary and retention policy. Never schedule real payments, customer messages or production inventory mutations as casual health probes.
Check browser assets and API behavior separately where the product can fail at either boundary. A rendered shell with a broken JavaScript bundle can still return HTTP 200.
Step 6: Cover asynchronous progress
A request can accept work while no worker completes it. Observe job age, completion progress and a bounded synthetic result where safe. Separate delayed work from failed work and permanent rejection.
Our Laravel queue and BullMQ comparison explains those processing boundaries. Avoid making an HTTP readiness request block until a long-running production job finishes.
| Rehearsal | Required behavior |
|---|---|
| Process starts slowly | Startup policy permits the measured initialization |
| Shared database disappears | Readiness and alert policy match the dependency contract |
| Worker stops | Background progress signal detects the impact |
| Public response is cached | Probe still obtains a current observation |
| Diagnostics fail | Public output stays bounded and reveals no secrets |
Step 7: Verify the consumer and recovery
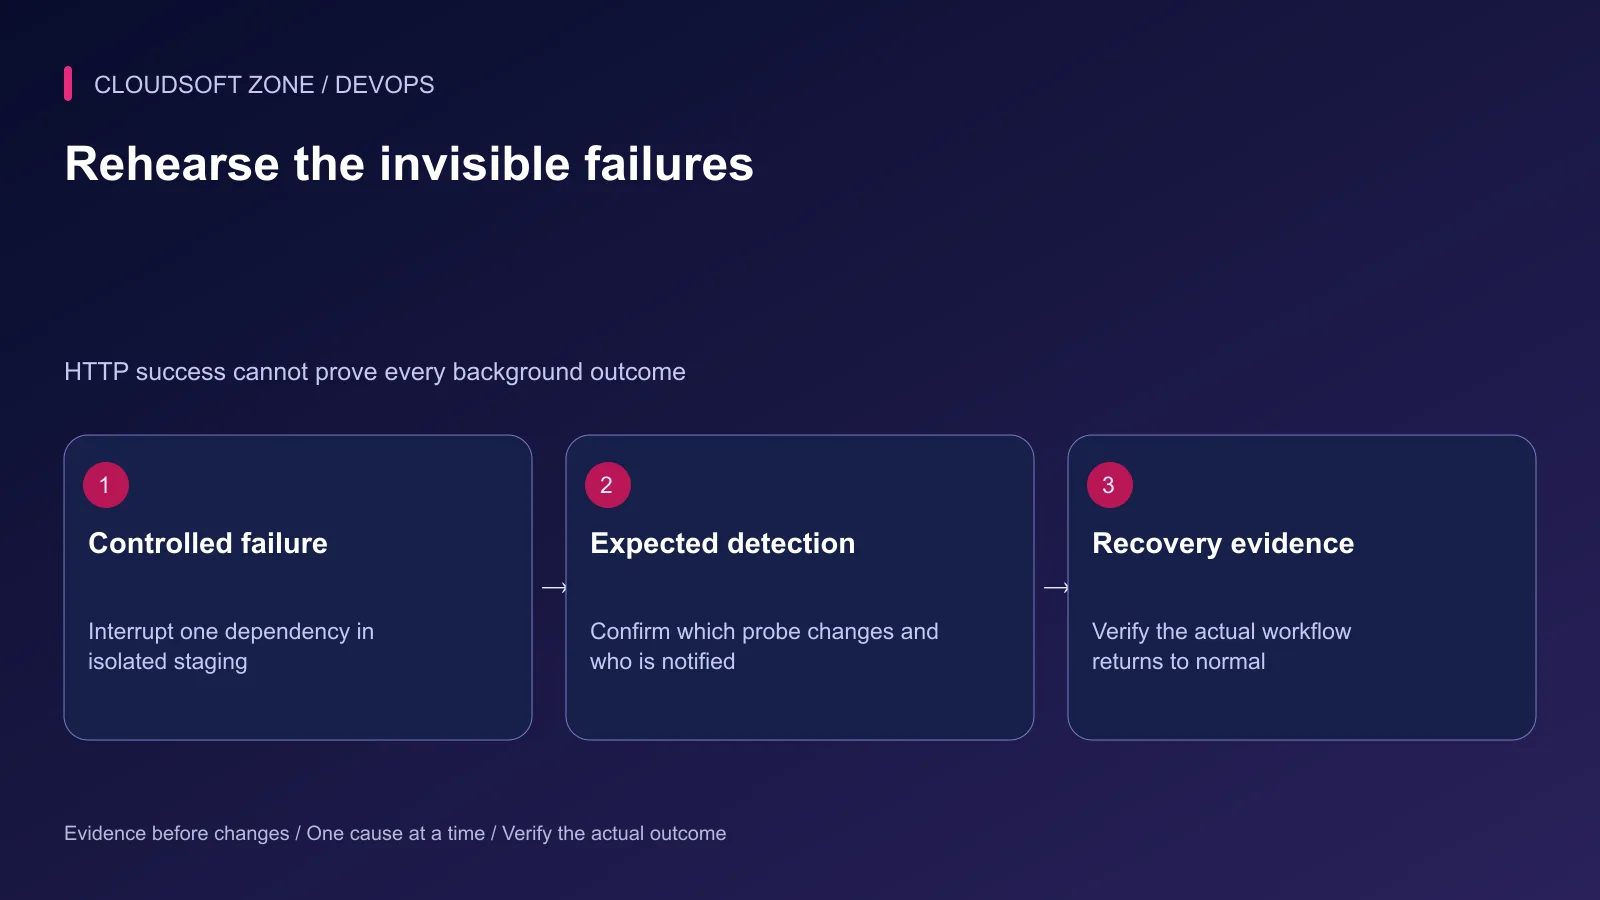
Rehearse controlled failures in isolated staging. Observe the probe result and the actual downstream action: removed traffic, an alert, or a deliberate restart. A correct response body with the wrong controller action remains a broken health design.
After recovery, confirm the original user journey and background outcomes, then observe stability. Keep the probe contract versioned with the application so future releases do not silently change its meaning.
For health and monitoring fitted to your service, discuss the project with Cloudsoft Zone.
Featured image: Cloudsoft Zone technical layout with nestjs artwork by NestJS (Public domain). Product mark resized proportionally for identification; no endorsement implied. Layout: CC BY-SA 4.0.
Frequently asked questions
Should liveness fail whenever the database is down?
Usually the shared database belongs in readiness or dependency monitoring rather than an automatic process-restart signal. Define behavior for your architecture and avoid restart storms.
Does Laravel’s default health route prove database access?
No. Its default success establishes application boot without an exception. Add reviewed dependency checks where the consumer requires them.
Does an unhealthy Docker health check automatically restart the container?
A Docker health check records health status. Ordinary Docker restart policies respond to container exits; health status alone does not automatically restart a running container.
Sources
- NestJS health indicators — NestJS
- Kubernetes probe actions and cautions — Kubernetes
- Laravel deployment health route — Laravel
- User-visible monitoring — Google SRE
- Docker health-check semantics — Docker
Read next
TutorialDevOps5 min read
Prometheus and Grafana monitoring for Laravel and Node.js applications
Use Prometheus and Grafana to connect private application metrics, host observations and actionable dashboards for Laravel and Node.js production workloads.
New tools, once a week
One short email listing what joined the directory.
Comments
No comments yet. Be the first to join the conversation.
Leave a comment
Every comment is read by a moderator before it appears. Your email address is never published; it is used only to contact you about this comment.
More from Cloudsoft Zone
TutorialDevOps5 min read
Production monitoring for a small SaaS: signals, alerts and recovery evidence you actually need
Build production monitoring around critical user journeys, application errors, queue progress and capacity signals, with actionable alerts and a verified delivery path.
By Nilesh Kushvaha
TutorialDevOps5 min read
Automated rollback for VPS deployments: release identity, compatibility and recovery gates
Design automated rollback around an exact previous release, schema compatibility and verified user recovery instead of blindly reverting every failed deployment.
By Nilesh Kushvaha
ComparisonDevOps5 min read
Blue-green vs rolling vs recreate deployments: choose a strategy your small team can operate
Compare blue-green vs rolling vs recreate deployments through capacity, mixed-version compatibility, worker behavior and realistic recovery requirements for a small team.
By Nilesh Kushvaha