
Prometheus and Grafana monitoring for Laravel and Node.js applications
Use Prometheus and Grafana to connect private application metrics, host observations and actionable dashboards for Laravel and Node.js production workloads.
5 min read
In this article
Your dashboard shows CPU usage, but it cannot explain whether an API route became slower after the latest deployment. The missing link is application instrumentation, not another host chart.
Prometheus and Grafana can give Laravel and Node.js teams a practical view of requests, dependency pressure and background work. Prometheus collects and queries metric series; Grafana presents those observations. Neither product automatically knows whether an invoice or upload completed correctly.
Start with our NestJS production API guide and Laravel production checklist. This article defines the integration contract rather than prescribing an unreviewed package for every application.
Step 1: Separate application and infrastructure metrics
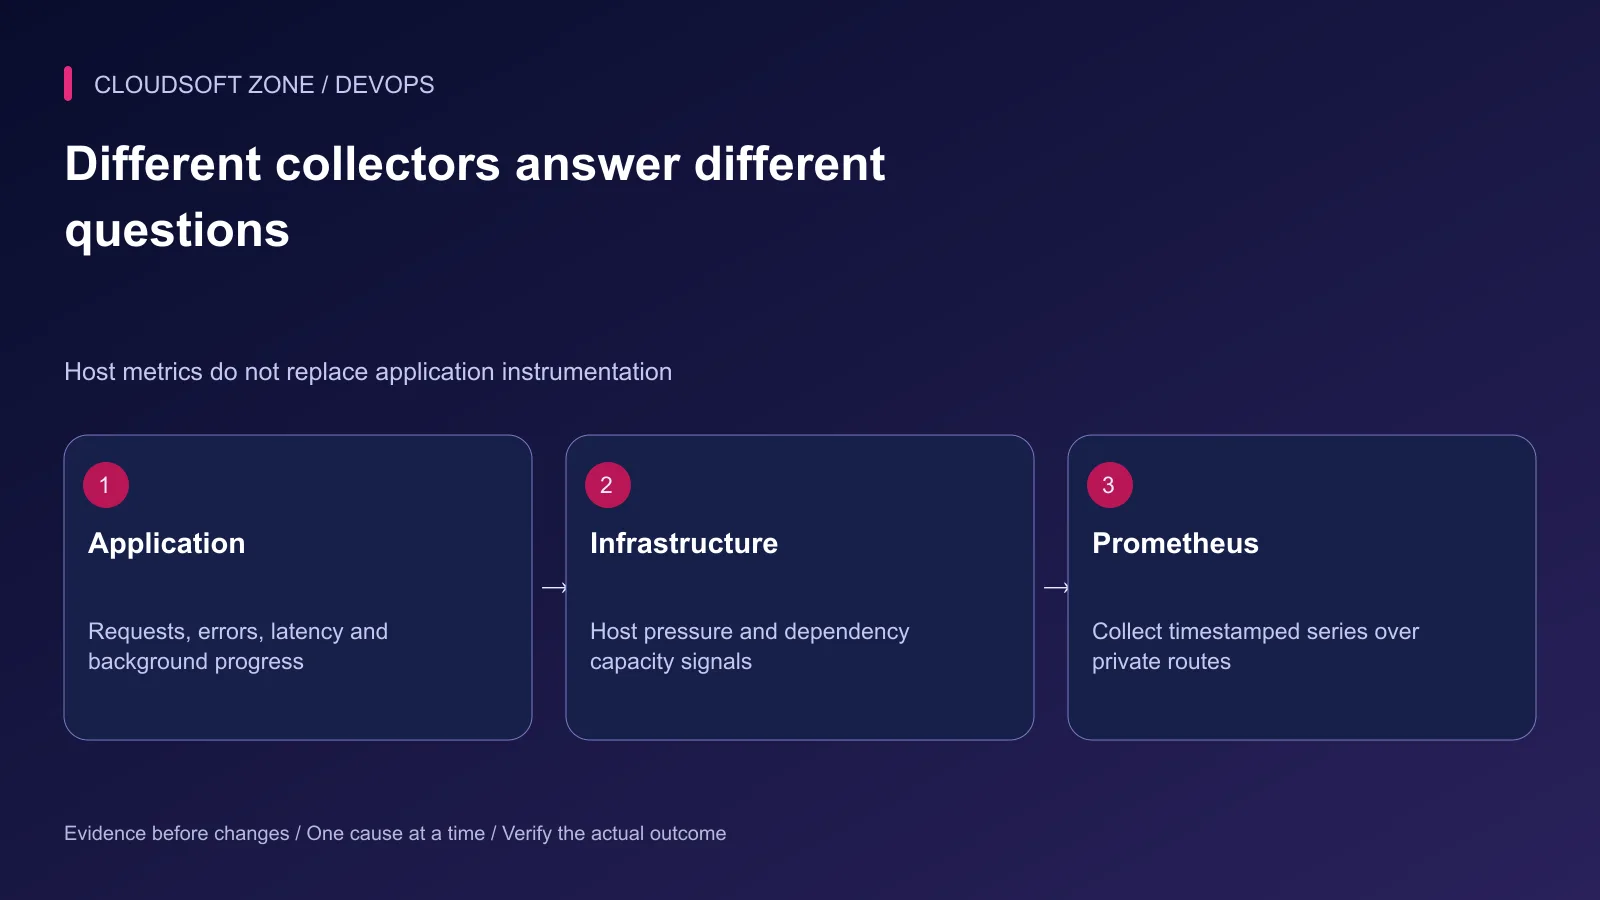
Instrument application request count, errors, duration and important background outcomes. Collect host memory, filesystem and CPU observations separately. Add dependency exporters only where their signals answer an operational question.
Node Exporter refers to the host exporter, not a library that measures Node.js requests. A host can have comfortable CPU usage while the application waits on a slow database or external provider.
| Collector | Useful observation | Does not establish |
|---|---|---|
| Application instrumentation | Route duration and outcomes | Host disk health |
| Node Exporter | Host and kernel resource signals | Successful business requests |
| Dependency exporter | Component capacity and operation signals | End-to-end user success |
| Synthetic probe | One configured external workflow | Every authenticated operation |
Document the expected metric names and units before building dashboards. A chart with an ambiguous unit can lead to the wrong capacity decision.
Step 2: Choose bounded labels
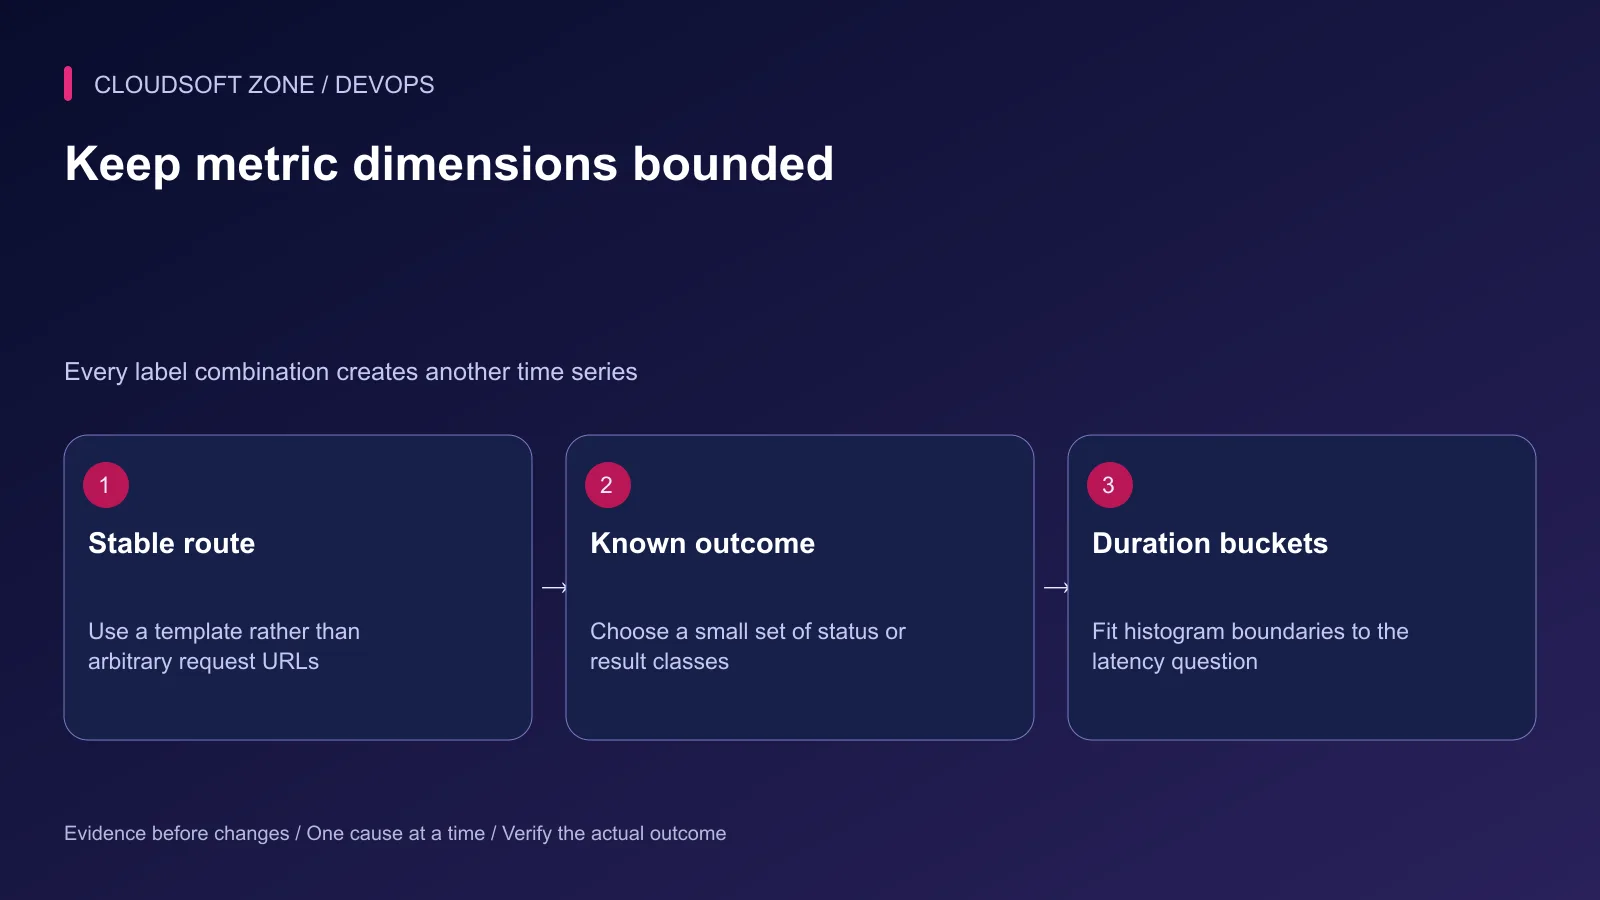
Use route templates such as an order-detail route with a parameter placeholder, not each actual URL. Choose a small allowlisted result or status dimension. Never include customer IDs, email addresses, raw query strings or tokens as labels.
Every unique label combination creates another series. A harmless-looking request identifier can make cardinality grow with every request, increasing storage and query cost without producing an actionable chart.
Keep correlation IDs in protected logs or traces. Metrics should answer aggregate behavior; detailed diagnosis can follow an authorized reference into another telemetry system.
Step 3: Define aggregation across application processes
Choose an instrumentation library compatible with the actual Laravel runtime or Node.js framework, and verify its maintenance and exposition behavior. Reuse existing telemetry ownership.
A Laravel web request and queue worker are separate processes. Node.js clustering or multiple replicas also creates multiple metric producers. Scraping one arbitrary process can hide work occurring elsewhere.
Decide whether every instance is scraped independently or a reviewed shared aggregation mechanism collects its observations. Avoid counter writes to a shared database on every request solely to manufacture a dashboard; assess instrumentation overhead and failure behavior.
Step 4: Add a private scrape contract
The following fragment assumes both applications already expose a reviewed metrics endpoint on their private listeners, reachable from the Prometheus network namespace:
scrape_configs:
  - job_name: laravel-app
    metrics_path: /internal/metrics
    static_configs:
      - targets: ['laravel-metrics.internal:8080']
  - job_name: node-app
    metrics_path: /internal/metrics
    static_configs:
      - targets: ['node-metrics.internal:8080']
These hostnames are examples, not publicly resolvable services. Add the applicable authentication and TLS configuration for your deployment. A public reverse proxy should not accidentally route this path to anonymous visitors.
Validate the full Prometheus configuration before an owned reload. Confirm the collector reaches the intended instances and that a deliberately unauthorized client cannot retrieve the same output.
Step 5: Query rates and latency correctly
For an application that emits a classic request-duration histogram named http_request_duration_seconds, this example estimates the combined 95th percentile by job:
histogram_quantile(
  0.95,
  sum by (le, job) (
    rate(http_request_duration_seconds_bucket[5m])
  )
)
The metric name must match your instrumentation. Native histograms use different query forms; do not copy the classic bucket expression into a different metric type.
Select buckets suited to the latency question. Quantile estimates depend on bucket resolution and sample volume. Low traffic can make a percentile unstable, so pair it with request counts and explicit workflow observations.
Do not average summary quantiles across instances and present the result as a valid fleet percentile. Also distinguish successful-request latency from quickly returned errors that can make an aggregate appear deceptively fast.
Step 6: Connect Prometheus and Grafana, then build a small dashboard
Configure the Prometheus data source using the address reachable from the Grafana server. Browser localhost and container localhost are not interchangeable targets.
Keep authentication enabled and restrict data-source access and outbound destinations. Read-only viewers still see the telemetry available to their role; avoid placing private payloads in metrics in the first place.
Place request success, latency and queue progress above diagnostic capacity panels. Add release annotations with the actual deployment time. Use readable legends, explicit units and consistent observation windows.
| Dashboard question | Verification |
|---|---|
| Are users affected? | Outcomes and a representative journey agree |
| What changed? | Release marker uses the deployed artifact and time |
| Is capacity constrained? | Relevant resource signals match the affected layer |
| Is collection missing? | Missing target or absent series is visible |
Step 7: Verify alerts and operating cost
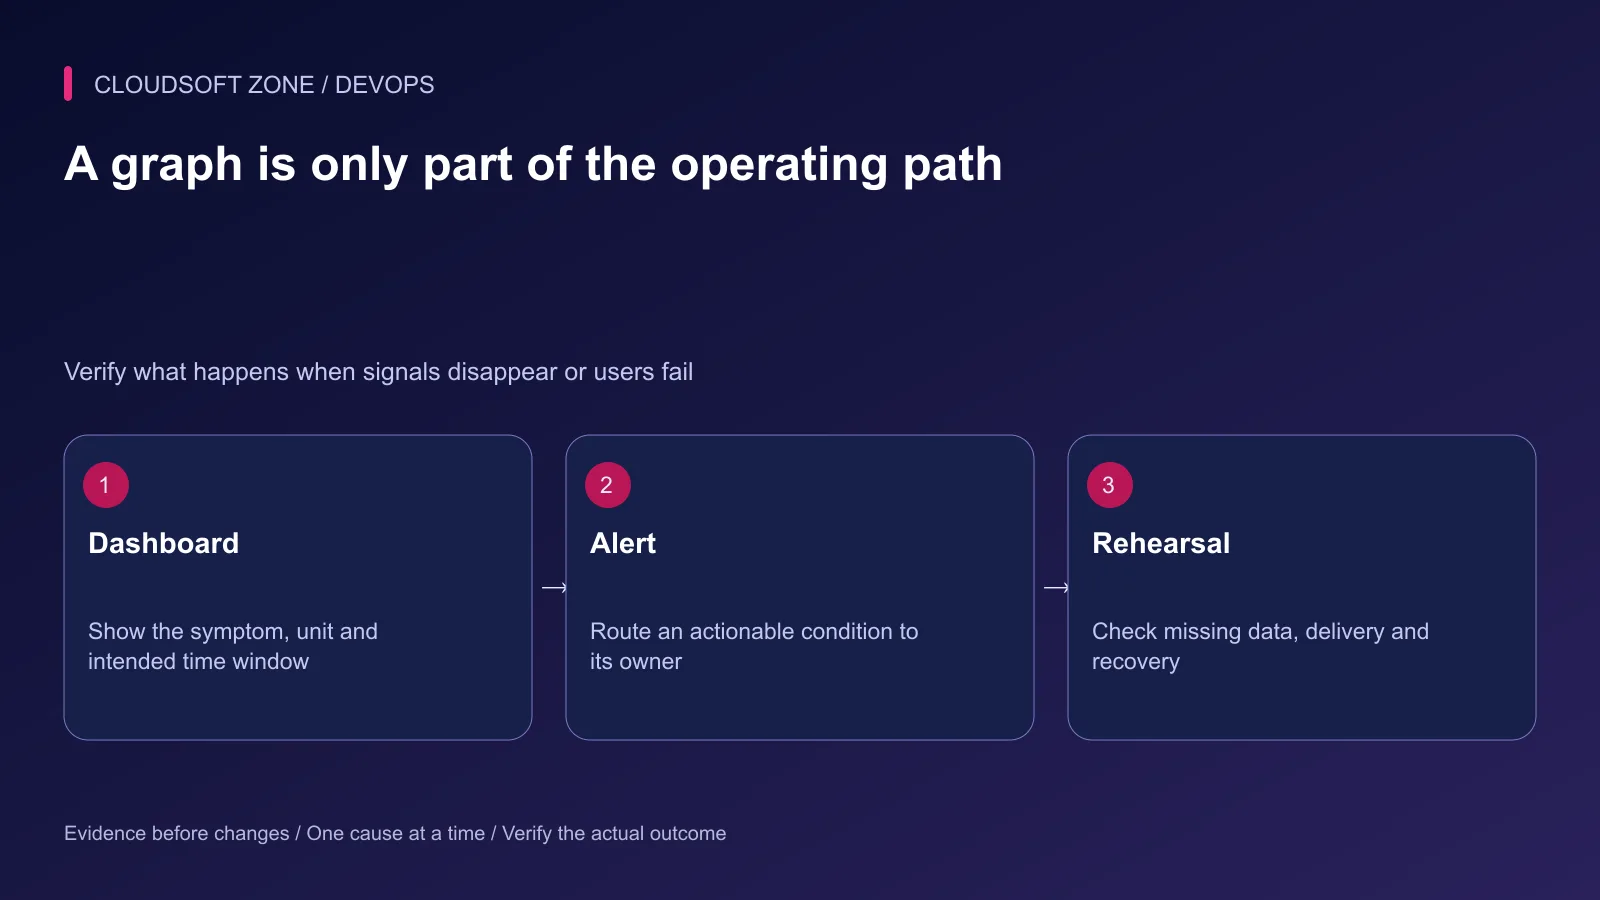
Rehearse an unavailable scrape target and a controlled application failure in an isolated environment. Verify separate collection and user-impact conditions, notification delivery and response ownership.
Measure metric cardinality and retention storage before expanding instrumentation. Set a retention and capacity budget; telemetry should not fill the application disk without warning.
For monitoring that fits your application and operating team, discuss your project with Cloudsoft Zone.
Featured image: Cloudsoft Zone technical layout with laravel artwork by Laravel (Public domain). Product mark resized proportionally for identification; no endorsement implied. Layout: CC BY-SA 4.0.
Frequently asked questions
Does Node Exporter monitor Node.js application requests?
No. Node Exporter exposes host and kernel metrics. Instrument the Node.js application separately to observe request outcomes, latency and queue behavior.
Can I average the latency percentiles reported by different application instances?
Do not assume that produces a valid combined percentile. Classic histogram buckets can be aggregated before calculating a percentile; summary quantiles do not combine that way.
Should Prometheus and Grafana be publicly accessible without login?
Keep metrics and dashboards behind appropriate network and identity controls. They can reveal internal topology and workload information.
Sources
- Prometheus instrumentation design — Prometheus
- Histogram and summary behavior — Prometheus
- Host monitoring with Node Exporter — Prometheus
- Scrape configuration — Prometheus
- Grafana Prometheus data source — Grafana
- Grafana security configuration — Grafana
Read next
TutorialDevOps5 min read
Production monitoring for a small SaaS: signals, alerts and recovery evidence you actually need
Build production monitoring around critical user journeys, application errors, queue progress and capacity signals, with actionable alerts and a verified delivery path.
New tools, once a week
One short email listing what joined the directory.
Comments
No comments yet. Be the first to join the conversation.
Leave a comment
Every comment is read by a moderator before it appears. Your email address is never published; it is used only to contact you about this comment.
More from Cloudsoft Zone
TutorialDevOps5 min read
Automated rollback for VPS deployments: release identity, compatibility and recovery gates
Design automated rollback around an exact previous release, schema compatibility and verified user recovery instead of blindly reverting every failed deployment.
By Nilesh Kushvaha
ComparisonDevOps5 min read
Blue-green vs rolling vs recreate deployments: choose a strategy your small team can operate
Compare blue-green vs rolling vs recreate deployments through capacity, mixed-version compatibility, worker behavior and realistic recovery requirements for a small team.
By Nilesh Kushvaha
TutorialDevOps5 min read
Stop a failed database migration from turning into a broken production deployment
Contain a failed database migration with explicit release gates, schema postconditions and reviewed recovery instead of switching code or retrying blindly.
By Nilesh Kushvaha