
Production stack monitoring: nginx, PHP-FPM, MySQL, Redis and queue workers
Build production stack monitoring with private nginx and PHP-FPM status, MySQL connection signals, Redis memory context and queue progress instead of process-only checks.
5 min read
In this article
Requests are timing out, but nginx is running, PHP-FPM is running and MySQL accepts connections. Restarting every service destroys useful evidence and can interrupt work without addressing the bottleneck.
Production stack monitoring should reveal which layer is waiting, which resource is constrained and whether useful work still completes. This guide covers nginx, PHP-FPM, MySQL, Redis and queue workers without treating process liveness as application health.
Use our Laravel production checklist for release readiness. The examples below are reader configuration fragments, not changes to a running deployment.
Step 1: Define the question for each component
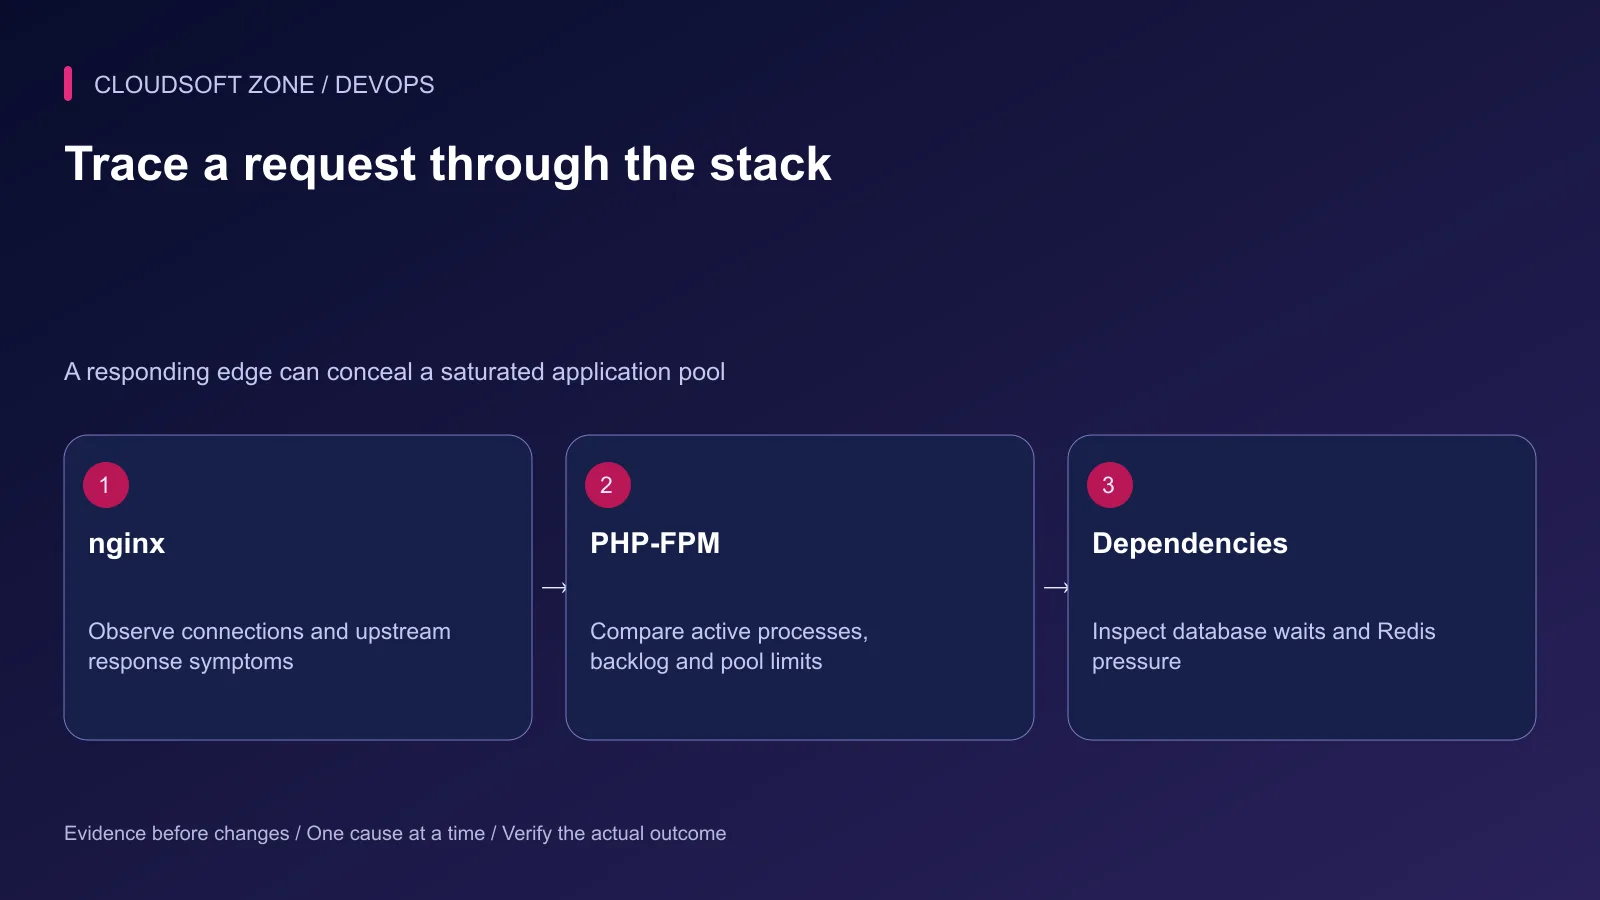
Record the public symptom first: affected route, start time, release identifier and expected behavior. Then collect component observations for that same interval. Comparing today's latency with last week's maximum connection count produces a weak diagnosis.
| Layer | Useful question | Supporting signal |
|---|---|---|
| nginx | Is the edge waiting on an upstream? | Response outcomes and upstream timings |
| PHP-FPM | Are requests waiting for a free process? | Listen queue, active processes and pool capacity |
| MySQL | Are connections or active queries constrained? | Connection pressure and query or lock evidence |
| Redis | Is its role operating within memory and persistence limits? | Memory, errors, evictions and role-specific behavior |
| Workers | Is accepted background work progressing? | Age, completions, failures and retries |
Define which observations justify an urgent response. Some growth trends belong in capacity planning; a stopped payment workflow deserves different handling.
Step 2: Collect nginx status privately
Check whether the installed nginx build includes the stub status module. It is not built by default in upstream nginx, although distribution packages can include it.
This example assumes an available host-local port and an authorized collector on that same host:
server {
    listen 127.0.0.1:8081;
    server_name localhost;

    location = /nginx-status {
        stub_status;
        allow 127.0.0.1;
        deny all;
    }
}
Validate the configuration with nginx's configuration check before an owned reload. A container's loopback address is a different network boundary; do not publish this listener to the internet to make an exporter reach it.
Stub status provides connection and request counters, not per-route error rates or application latency. Derive rates with counter-reset awareness. Active connections include waiting connections, so a large total does not necessarily mean every connection is executing application work.
Step 3: Read PHP-FPM pool pressure
Enable and route the status path through the existing private FastCGI configuration. Setting pm.status_path alone does not create a safe HTTP endpoint. Restrict access before enabling detailed collection.
Compare the listen queue, active and idle processes, current pool configuration and memory pressure. A maximum-children counter records that the limit was reached; interpret its change over the observation window rather than treating an old nonzero value as a fresh incident.
PHP supports a separate status listener that can answer independently when the main pool is occupied. That improves observability, but it does not establish that normal application requests are healthy.
Avoid increasing process counts immediately. More PHP processes can consume the remaining host memory and create more simultaneous database work. Measure process memory and dependency capacity before changing concurrency.
Step 4: Separate database connections from database work
Using an authorized monitoring connection on the intended MySQL instance, this read-only query selects a small set of global observations:
SHOW GLOBAL STATUS
WHERE Variable_name IN (
  'Threads_connected',
  'Threads_running',
  'Max_used_connections',
  'Connection_errors_max_connections'
);
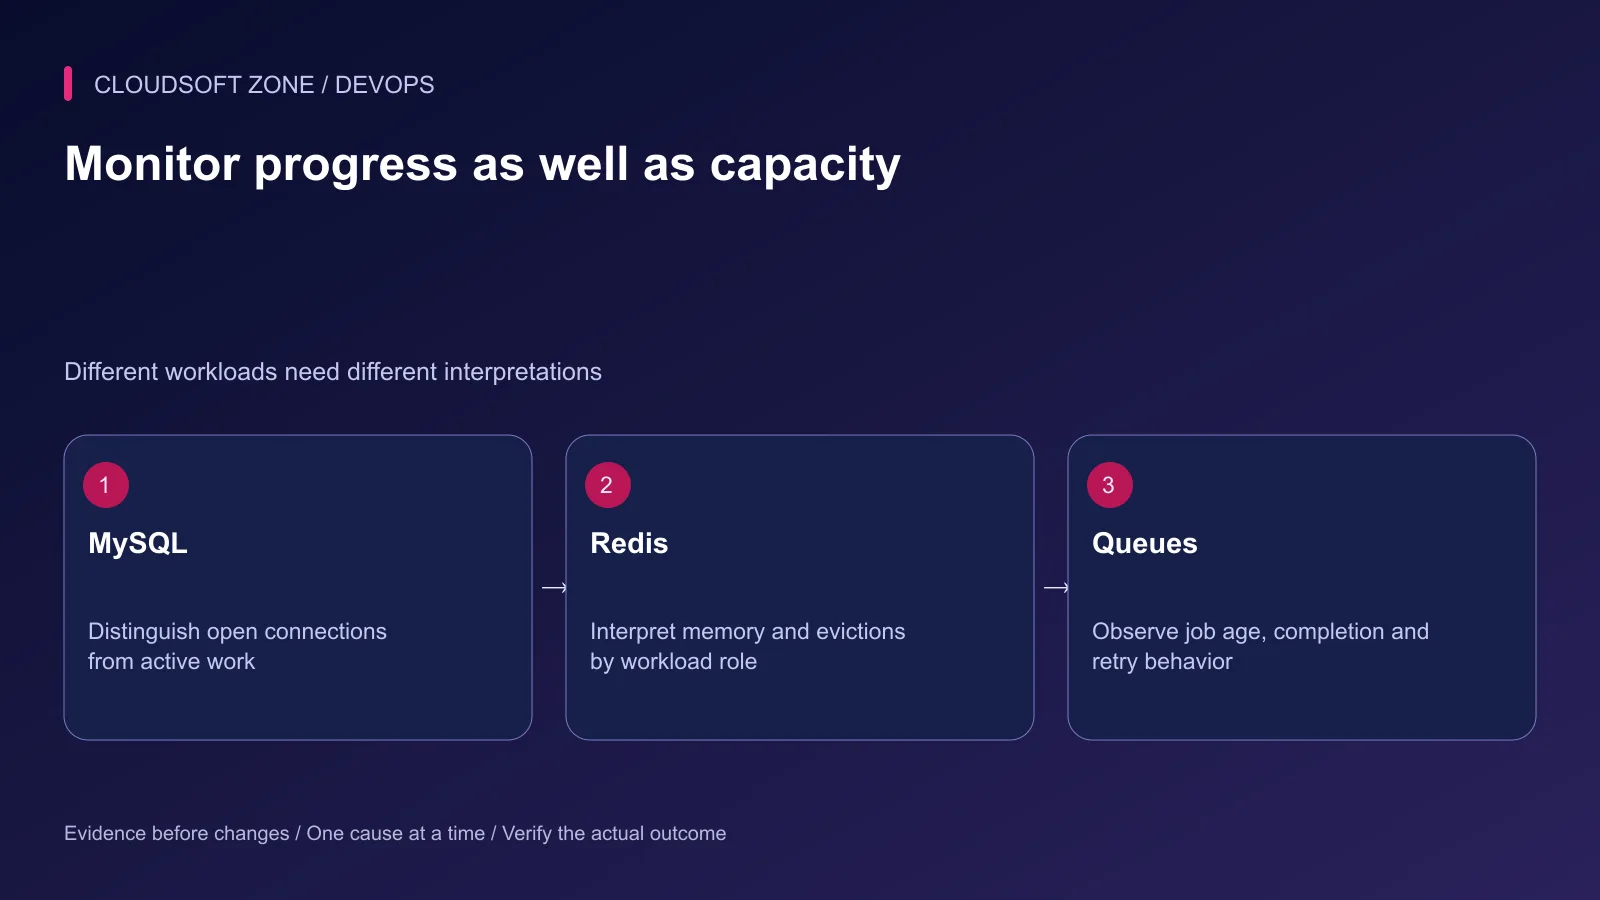
Confirm account privileges and version-specific meanings before relying on the output. Open connections differ from actively executing work. A historical maximum is not current utilization, and a refused-connection counter needs a time window.
Correlate these signals with application pool waits, query latency and lock evidence. Raising the server connection limit can worsen memory pressure when the actual cause is slow queries or excessive application concurrency.
Step 5: Interpret Redis by its workload
Use bounded INFO sections through an existing authorized client. Keep the raw diagnostic output private. Do not enable broad command tracing as a routine monitoring substitute: commands can carry sensitive payloads and collection has an operational cost.
Distinguish logical memory usage from process resident memory. Examine evictions, rejected connections and persistence errors in the context of the configured role.
A cache can deliberately evict expendable values. A queue broker requires a different loss and persistence contract. Blocking clients can be legitimate queue consumers; investigate progress rather than declaring every blocked client unhealthy.
Step 6: Monitor worker progress
Track the oldest relevant job age, completion rate, retries and failed jobs. Separate priority queues where service expectations differ. Worker process presence alone cannot prove that it is consuming the correct connection and queue.
Laravel's queue monitoring can report excessive queue counts, but the notification listener and delivery channel still need configuration. Queue depth also needs context: many quickly completed jobs differ from a few jobs stalled for an hour.
Our Laravel queues and BullMQ comparison explains the application-level boundaries.
| Observation | First bounded investigation |
|---|---|
| FPM backlog rises | Compare pool saturation, request duration and memory |
| Database waits rise | Inspect slow work and application concurrency |
| Redis evictions change | Confirm workload role and memory policy |
| Queue age rises | Confirm consumers, failures and dependency availability |
Step 7: Rehearse failure detection and recovery
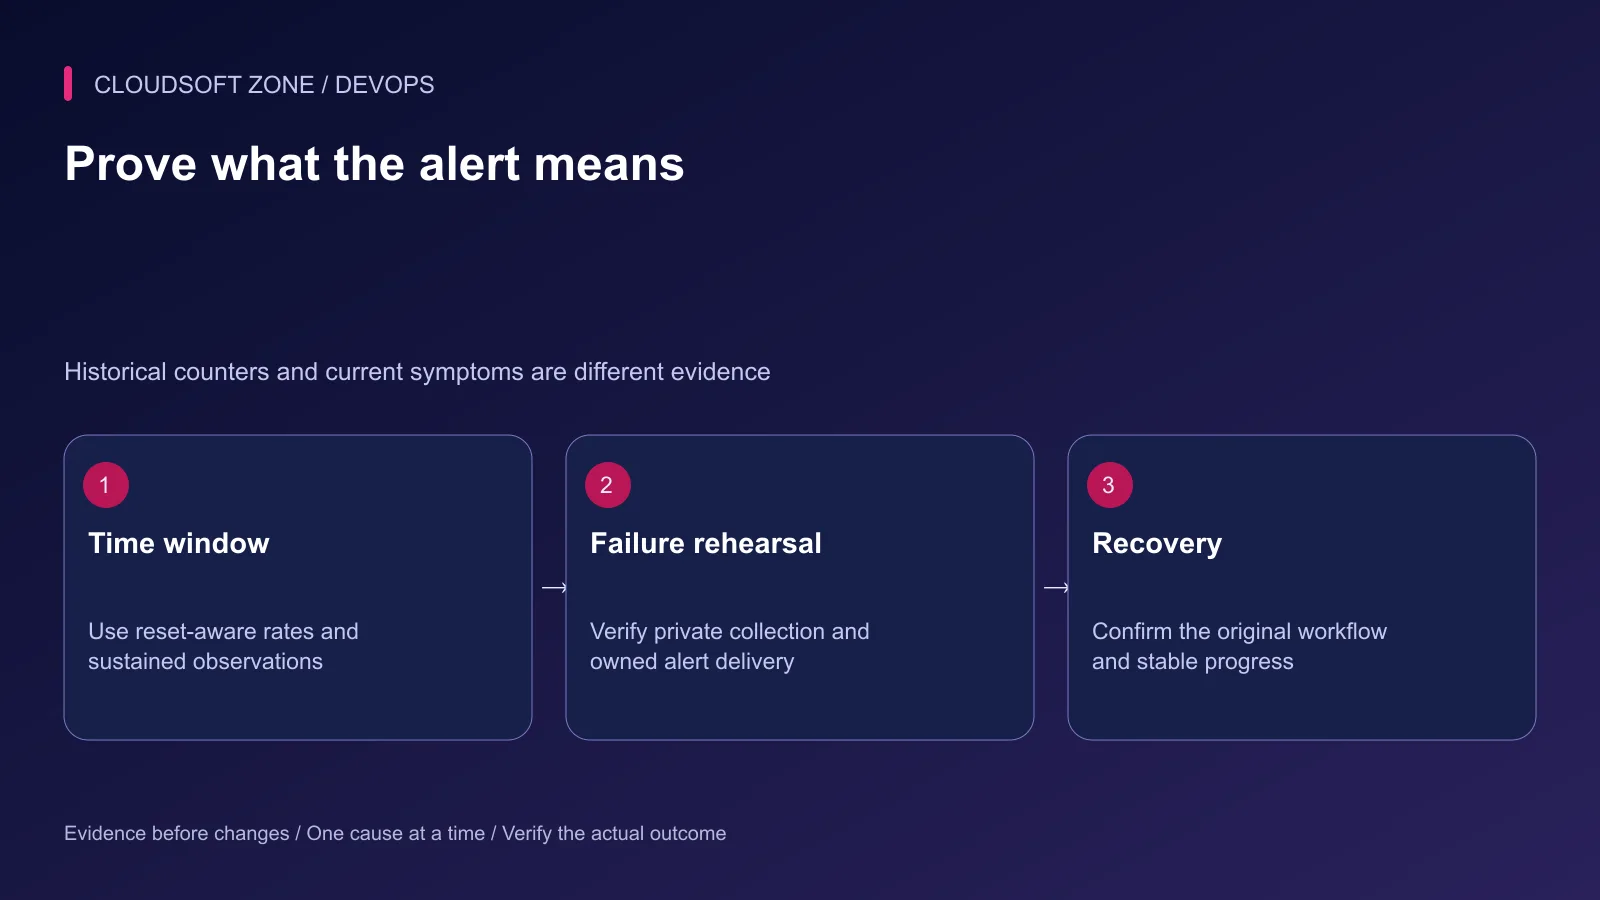
In an isolated environment, exercise missing collection, stalled queue consumption and an unavailable dependency. Confirm that the alert identifies the right component, reaches its owner and links a bounded response.
After mitigation, recheck the original request or background outcome and observe stability. Preserve before-and-after evidence with timestamps; do not substitute a restart for proof.
For a monitoring design matched to your application's workload and operating team, discuss your project with Cloudsoft Zone.
Featured image: Cloudsoft Zone technical layout with nginx artwork by Igor Sysoev (Public domain). Product mark resized proportionally for identification; no endorsement implied. Layout: CC BY-SA 4.0.
Frequently asked questions
Does nginx stub status report application latency?
No. It reports basic connection and request counters. Use application instrumentation or appropriately designed access-log metrics for latency and response outcomes.
Is a PHP-FPM status endpoint safe to expose publicly?
No. Restrict it to authorized monitoring clients. Detailed output can reveal internal requests, script paths and process information.
Should a high Redis blocked-client count always trigger a page?
No. Blocking consumers can be normal for queues. Interpret the count with queue age, progress, connection limits and the intended workload.
Sources
- nginx basic status module — nginx
- PHP-FPM status fields — PHP
- PHP-FPM pool configuration — PHP
- MySQL 8.4 server status variables — MySQL
- Redis INFO sections — Redis
- Laravel queue monitoring — Laravel
Read next
TutorialDevOps5 min read
GitLab CI/CD for Laravel: test, build and deploy a reviewed release to a VPS
Design GitLab CI/CD for Laravel with a reviewed PHP image, disposable MySQL checks, explicit artifacts, protected credentials and serialized VPS deployments.
New tools, once a week
One short email listing what joined the directory.
Comments
No comments yet. Be the first to join the conversation.
Leave a comment
Every comment is read by a moderator before it appears. Your email address is never published; it is used only to contact you about this comment.
More from Cloudsoft Zone
TutorialDevOps5 min read
Stop a failed database migration from turning into a broken production deployment
Contain a failed database migration with explicit release gates, schema postconditions and reviewed recovery instead of switching code or retrying blindly.
By Nilesh Kushvaha
TutorialDevOps5 min read
Laravel CI/CD with GitHub Actions: verification, release artifacts and guarded deployment
Build Laravel CI/CD with GitHub Actions using locked dependencies, isolated verification, immutable release artifacts and a protected deployment job with explicit recovery gates.
By Nilesh Kushvaha
TutorialDevOps5 min read
Laravel Docker Compose with nginx, MySQL and Redis: separate images, workers and retained data
Design a Laravel Docker Compose stack with matching PHP/nginx artifacts, private database and Redis services, explicit worker lifecycle and retained storage contracts.
By Nilesh Kushvaha