
Application error monitoring without logging sensitive data
Set up application error monitoring with safe event fields, release context and verified redaction instead of forwarding customer payloads, tokens and raw exception context.
4 min read
In this article
An error tracker is useful until a failed request sends its authorization header, uploaded document or payment payload into a shared monitoring account. Debugging access should not become unrestricted access to customer data.
Application error monitoring starts with a diagnostic-data policy: what may be collected, where filtering happens, who can access it and how long it remains available. This guide covers Laravel and Node.js applications without assuming a provider's default scrubbing catches everything.
Our Laravel audit-log guide separates accountable business events from diagnostic telemetry. Preserve those different purposes and access rules.
Step 1: Define allowed diagnostic fields for application error monitoring
Keep stable error codes, service identity, an exact release reference and a non-secret correlation reference. Add reviewed route templates and outcome classes where they help diagnose the failure.
Avoid copying complete request objects or exception context into custom metadata. Exception messages can contain query parameters, database values, provider responses and local file paths.
| Field | Default policy | Safer diagnostic substitute |
|---|---|---|
| Authorization and cookies | Exclude | Authentication outcome code |
| Request body | Exclude | Reviewed operation or validation code |
| Raw URL query | Exclude | Route template and safe parameter category |
| Customer email or document | Exclude | Protected internal lookup reference if necessary |
| Release identifier | Include when non-secret | Exact deployed artifact reference |
A pseudonymous identifier can still be sensitive and linkable. Do not describe hashing customer data as automatic anonymization.
Step 2: Build events from an allowlist
The following Node.js example builds a narrow application-owned event. It deliberately accepts no request object or exception message:
const allowedCodes = new Set([
  'DEPENDENCY_UNAVAILABLE',
  'UPLOAD_STORAGE_FAILURE',
  'JOB_EXECUTION_FAILURE',
]);

function diagnosticEvent(code, release) {
  if (!allowedCodes.has(code)) return null;
  if (typeof release !== 'string') return null;
  if (!/^[a-f0-9]{40}$/.test(release)) return null;
  return {
    service: 'example-api',
    severity: 'error',
    code,
    release,
    occurredAt: new Date().toISOString(),
  };
}
The release format assumes a full hexadecimal commit identifier and must match your artifact contract. This is an event-building example, not a complete monitoring SDK integration. Its narrow scope does not filter automatic exception capture, browser telemetry or other independently enabled channels.
Keep richer investigation details in an appropriately protected local system when necessary. An external monitoring event can point an authorized operator toward that evidence without exporting its contents.
Step 3: Review the installed SDK's actual behavior
Check the exact SDK version, framework integration and configured data-collection options. Default settings and option names evolve. Do not infer privacy from an old tutorial or a single setting intended to reduce default personal information.
Review pre-send hooks, integrations and collector processors against the event types they handle. Exception filtering, transaction or span filtering and log filtering can be separate paths.
Sentry has published scrubbing advisories involving headers and URL-related span attributes. Treat those as a reason to verify the installed version and inspect payloads, not as proof that every current configuration is unsafe or already repaired.
Step 4: Check every capture channel
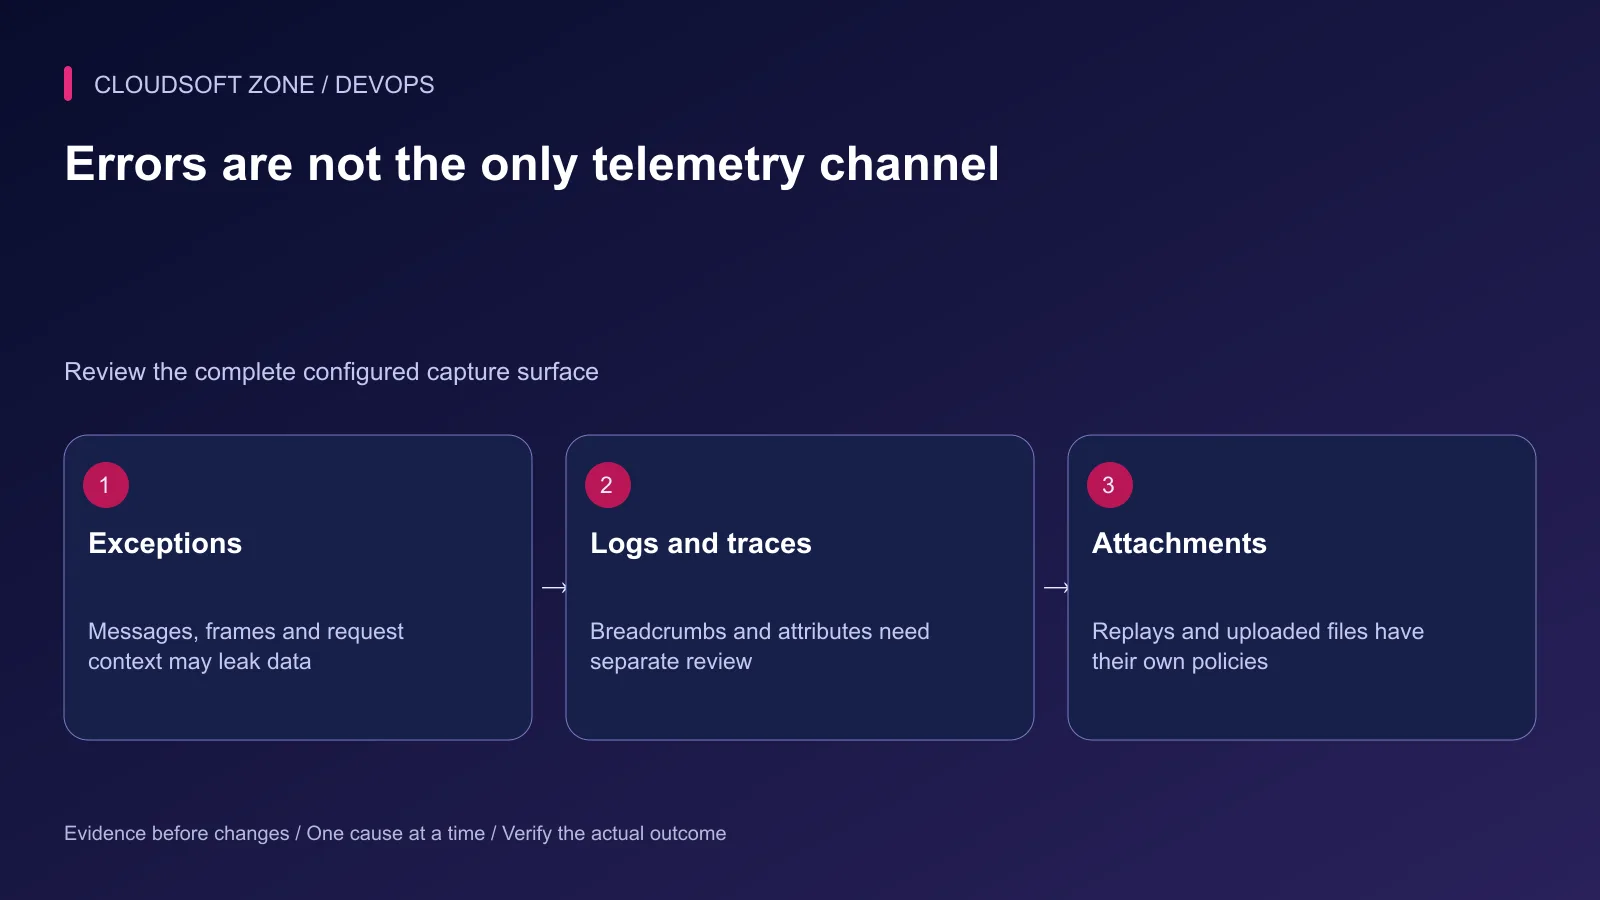
Inspect exception messages, stack frames, request metadata, user context, breadcrumbs, logs, trace attributes and attachments. Session replay and screenshot features require their own deliberate enablement and masking review.
Avoid forwarding raw provider response bodies. A failed payment or identity-provider request can contain more sensitive context than a successful one.
Decide how source maps are uploaded and accessed. They improve release-specific diagnosis, but deployment should not accidentally expose private build artifacts or upload credentials in browser bundles. Match maps to the actual deployed release so the decoded stack is meaningful.
Step 5: Apply provider-side controls
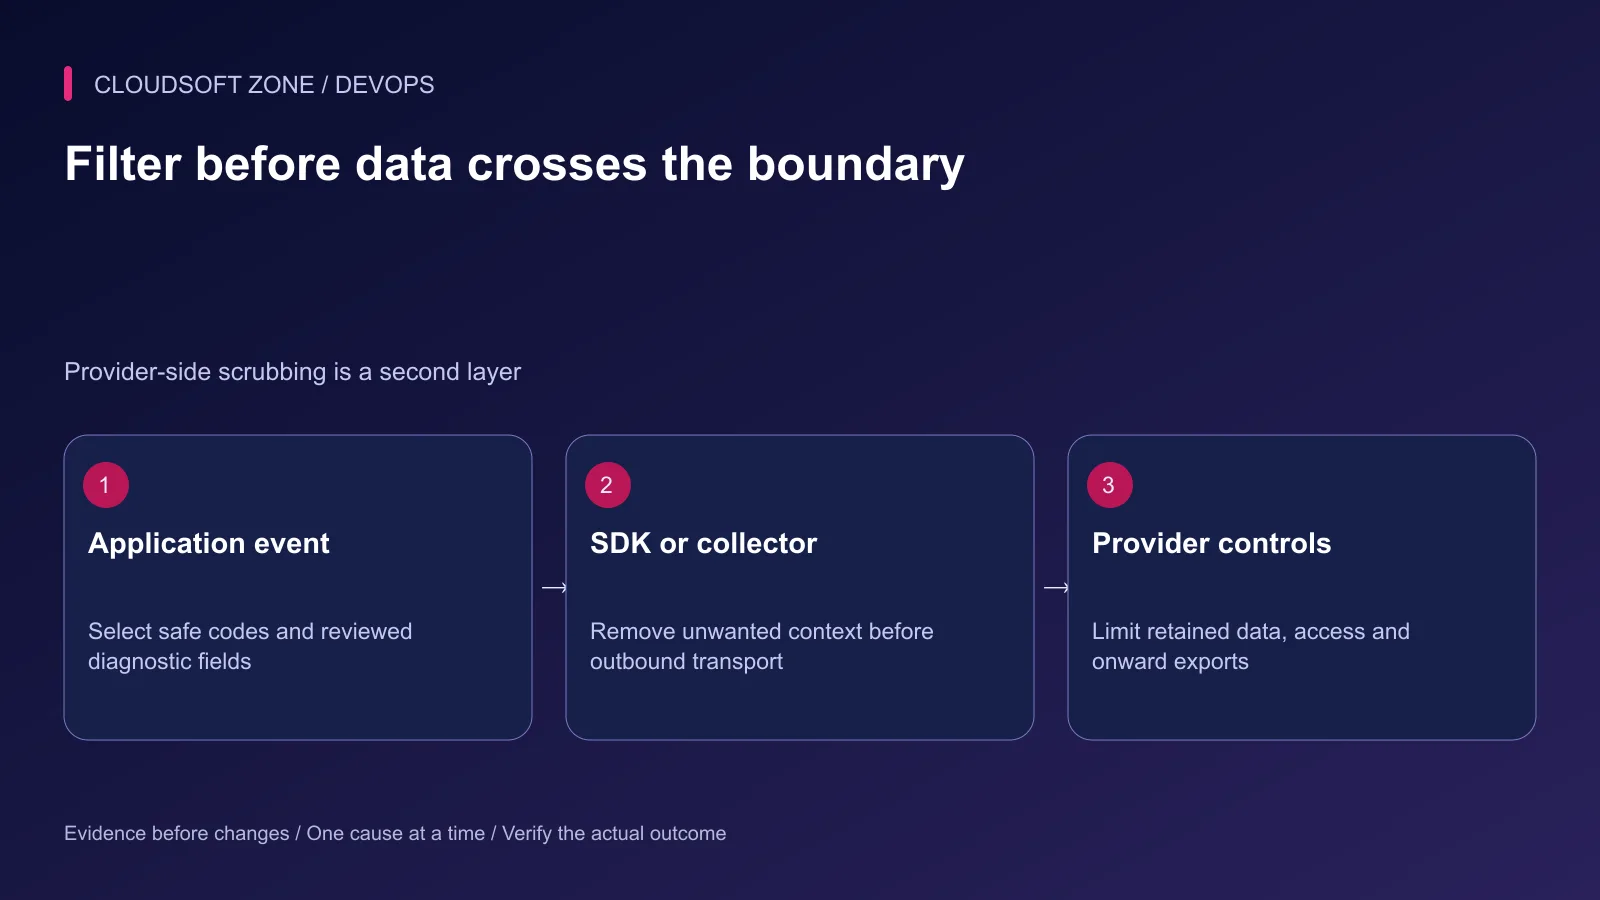
Configure server-side scrubbing as another layer. It does not change the fact that an outbound payload has reached the provider. Limit project membership, integrations, exports and retention to the operational need.
Keep credentials for upload and administration separate from application ingestion configuration. A browser-visible ingestion identifier is not a substitute for server-side authorization or abuse controls.
Document retention for local buffers, provider records and exported incident attachments. Removing one stored event does not automatically remove every copy.
Step 6: Verify with synthetic privacy fixtures
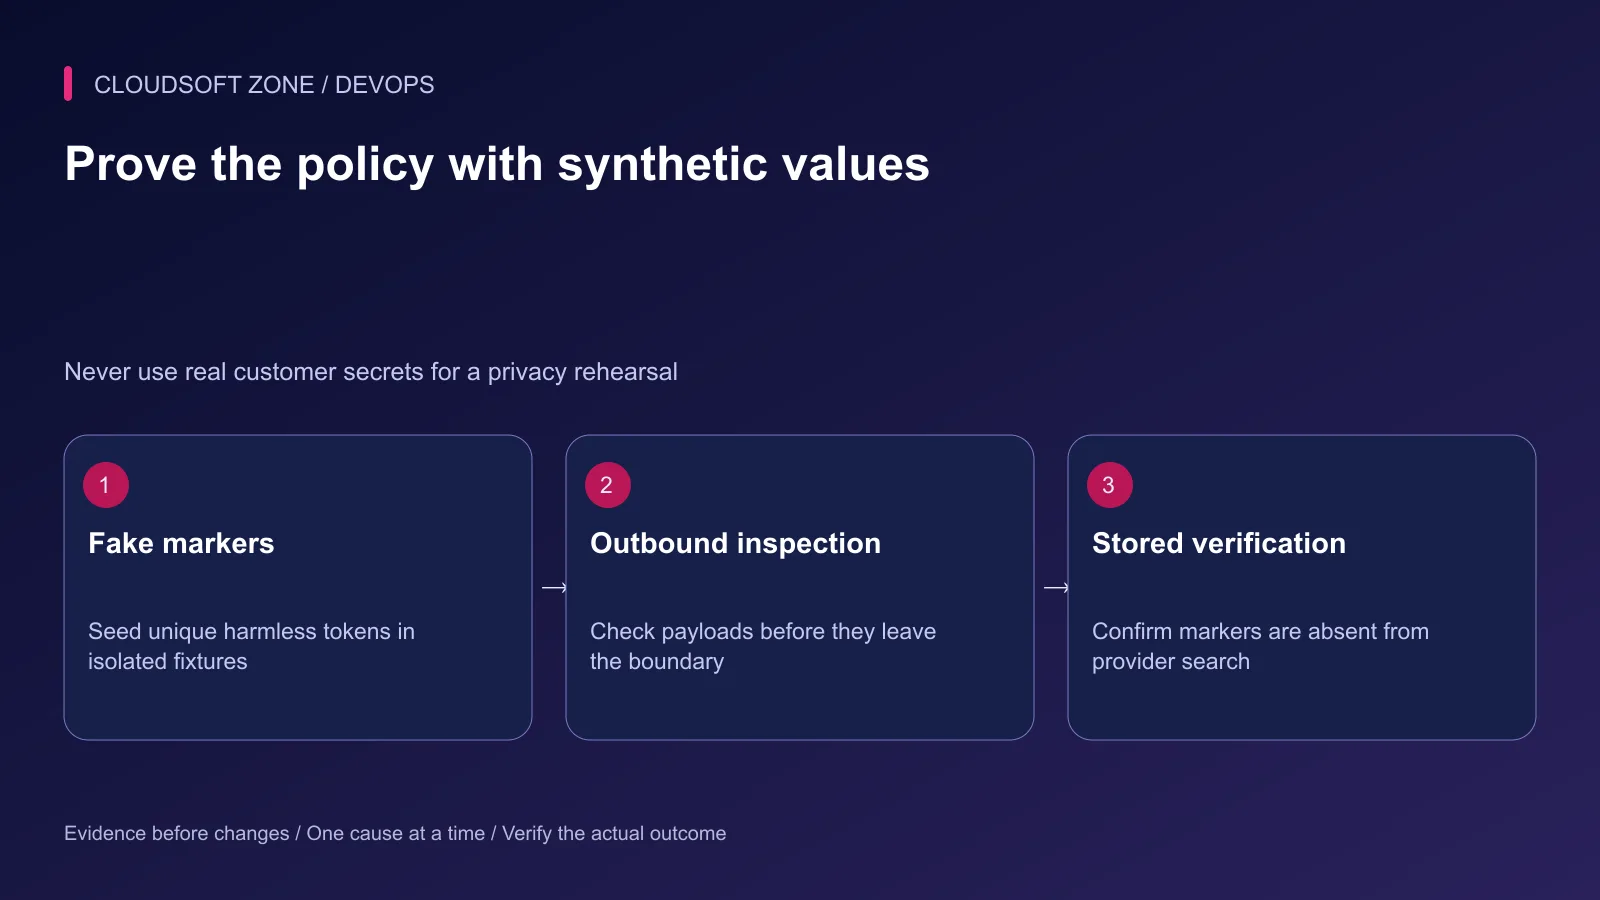
In an isolated environment, place unique harmless markers in fake authorization headers, URLs, bodies, cookies and exception messages. Trigger the relevant capture paths and inspect the outbound transport before enabling production collection.
Search the stored event, linked traces and attachments for those markers. A cleaned issue summary can hide sensitive data in another tab or channel.
| Rehearsal | Acceptance evidence |
|---|---|
| Fake header and cookie markers | Absent from outbound and retained telemetry |
| Fake query and body markers | Removed across request and span context |
| SDK upgrade | The same privacy fixtures still pass |
| Provider unavailable | Application requests remain bounded and usable |
Step 7: Bound failure and handle discoveries
Set finite transport timeouts, queue capacity and retry behavior. Error monitoring should not block every request indefinitely or fill the disk during a provider outage.
If real sensitive data is discovered, stop the offending capture path, restrict access and follow the organization's incident procedure. Revoke exposed credentials at their issuer; deleting a dashboard entry does not revoke a token.
Our AI observability guide applies similar boundaries to prompts and tool traces. For monitoring integrated safely with your application, discuss the project with Cloudsoft Zone.
Featured image: Cloudsoft Zone technical layout with nestjs artwork by NestJS (Public domain). Product mark resized proportionally for identification; no endorsement implied. Layout: CC BY-SA 4.0.
Frequently asked questions
Is disabling default PII collection a complete privacy guarantee?
No. Custom context, exception messages, URLs, logs, spans, attachments and other integrations can still contain sensitive data. Review the installed SDK and every enabled channel.
Can provider-side scrubbing replace local filtering?
No. Provider-side scrubbing is useful defense in depth, but the data has already crossed the transport boundary. Minimize and filter locally first.
Should the error-monitoring provider be required for requests to succeed?
Usually no. Bound the transport, queues and retry budget so monitoring failure does not become a new application outage.
Sources
- Logging fields and protection — OWASP
- Telemetry sensitive-data handling — OpenTelemetry
- Sentry scrubbing boundaries — Sentry
- Sentry span scrubbing advisory context — Sentry
- Sentry JavaScript header advisory — Sentry
Read next
TutorialDevOps5 min read
Application health checks: why uptime monitoring misses real failures
Design application health checks that separate liveness, readiness and real user outcomes, without creating restart storms or dangerous synthetic side effects.
New tools, once a week
One short email listing what joined the directory.
Comments
No comments yet. Be the first to join the conversation.
Leave a comment
Every comment is read by a moderator before it appears. Your email address is never published; it is used only to contact you about this comment.
More from Cloudsoft Zone
TutorialDevOps5 min read
Prometheus and Grafana monitoring for Laravel and Node.js applications
Use Prometheus and Grafana to connect private application metrics, host observations and actionable dashboards for Laravel and Node.js production workloads.
By Nilesh Kushvaha
TutorialDevOps5 min read
Production stack monitoring: nginx, PHP-FPM, MySQL, Redis and queue workers
Build production stack monitoring with private nginx and PHP-FPM status, MySQL connection signals, Redis memory context and queue progress instead of process-only checks.
By Nilesh Kushvaha
TutorialDevOps5 min read
Production monitoring for a small SaaS: signals, alerts and recovery evidence you actually need
Build production monitoring around critical user journeys, application errors, queue progress and capacity signals, with actionable alerts and a verified delivery path.
By Nilesh Kushvaha